
Solana continues to extend its gains after rallying over the past few days. At the time of writing on Tuesday, $SOL is trading above $137, up by more than 7% in the last seven days.
The rally is fueled by institutional demand for $SOL as spot exchange-traded funds (ETFs) recorded positive flows of more than $16 million on Monday. The inflow was the largest single-day inflow since mid-December.
In addition to that, on-chain metrics support the current bullish outlook, with further gains expected in the near term.
Institutional demand pushes $SOL to $139
Copy link to section
$SOL has added more than 1.5% to its value in the last 24 hours and briefly touched the $139 level. The rally comes as institutional demand for Solana ETFs continues to increase.
Spot $SOL ETFs were launched on October 28 and have recorded excellent inflows since then.
According to SoSoValue, spot Solana ETFs recorded $16.24 million in inflows on Monday, the highest single-day inflow since mid-December.
Thanks to yesterday’s inflow, the total net assets have now surpassed $1 billion, suggesting rising institutional demand.
If the inflow continues, $SOL’s price could rally to a new monthly high.
Solana’s on-chain data shows bullish bias, with spot and futures markets showing large whale orders, cooling conditions, and buy-side dominance.
These conditions suggest a shift to bullish sentiment among traders, which could result in further upward movement of price in the near to medium term.
According to DeFiLlama, $SOL’s stablecoin total supply has been recovering since the start of the year and currently stands at $15.32 billion. The growing stablecoin activity and price increase also add another confluence to the bullish bias.
$SOL bulls aim to push the price to $150
Copy link to section
Similar to Bitcoin, Ether, and XRP, $SOL’s 4-hour chart has switched bullish thanks to the coin’s rally over the past few days. $SOL’s price broke above the upper trendline of a falling wedge pattern late last month and has added nearly 12% to its value since then.
At press time, $SOL is trading at $137 per coin. If the bullish trend continues, $SOL could extend the rally toward the next resistance level at $150.61, its 100-day EMA.
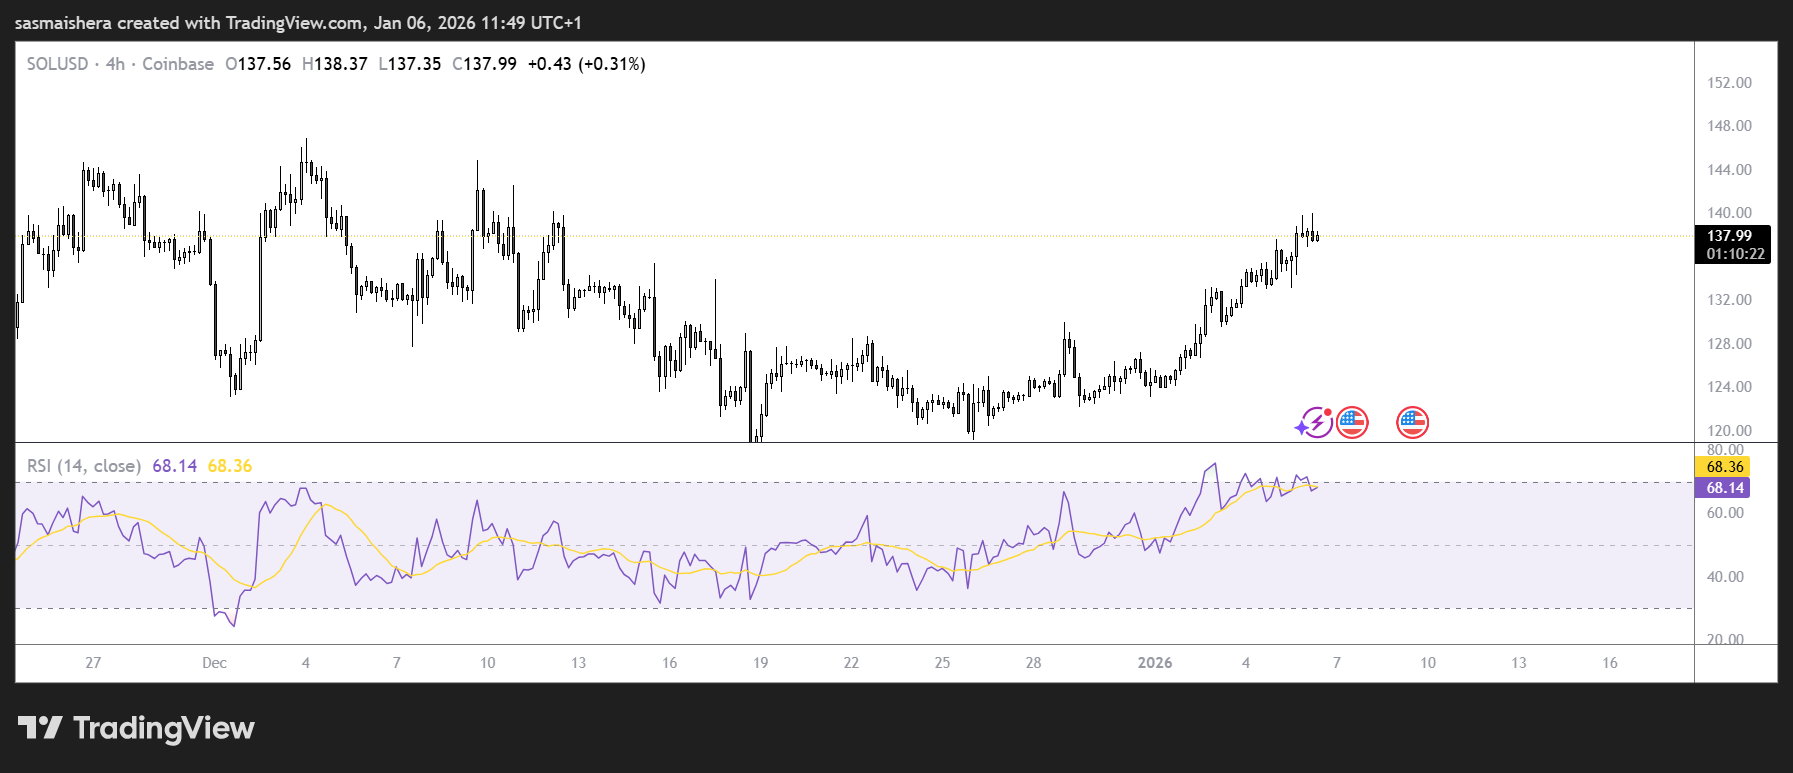
The Relative Strength Index (RSI) on the 4-hour chart reads 70, approaching the overbought level of 80, indicating bullish momentum gaining traction.
Furthermore, the Moving Average Convergence Divergence (MACD) indicator shows a bullish crossover and rising green histogram bars above the neutral level, giving the bulls further confluence.
However, the market could undergo a correction following days of bullish movements. If that happens, $SOL could decline towards the nearest support around the weekly level at $126.65.
The next major support level stands at $120, and the bulls could defend this zone in case of a pullback.