
Onyxcoin price has surged nearly 52% in the past 24 hours, extending its seven-day rally to over 100%. Such sharp moves often raise one key question. Is this a short squeeze driven by leverage, or a move backed by real demand?
So far, the data leans toward the second option. While volatility remains high, multiple indicators suggest the rally is not purely accidental. Volume, capital flow, and derivatives positioning all point to a market that is active, but not overheated. Here is what the charts are actually saying.
Trend Breakout and Volume Confirm Buyer Support
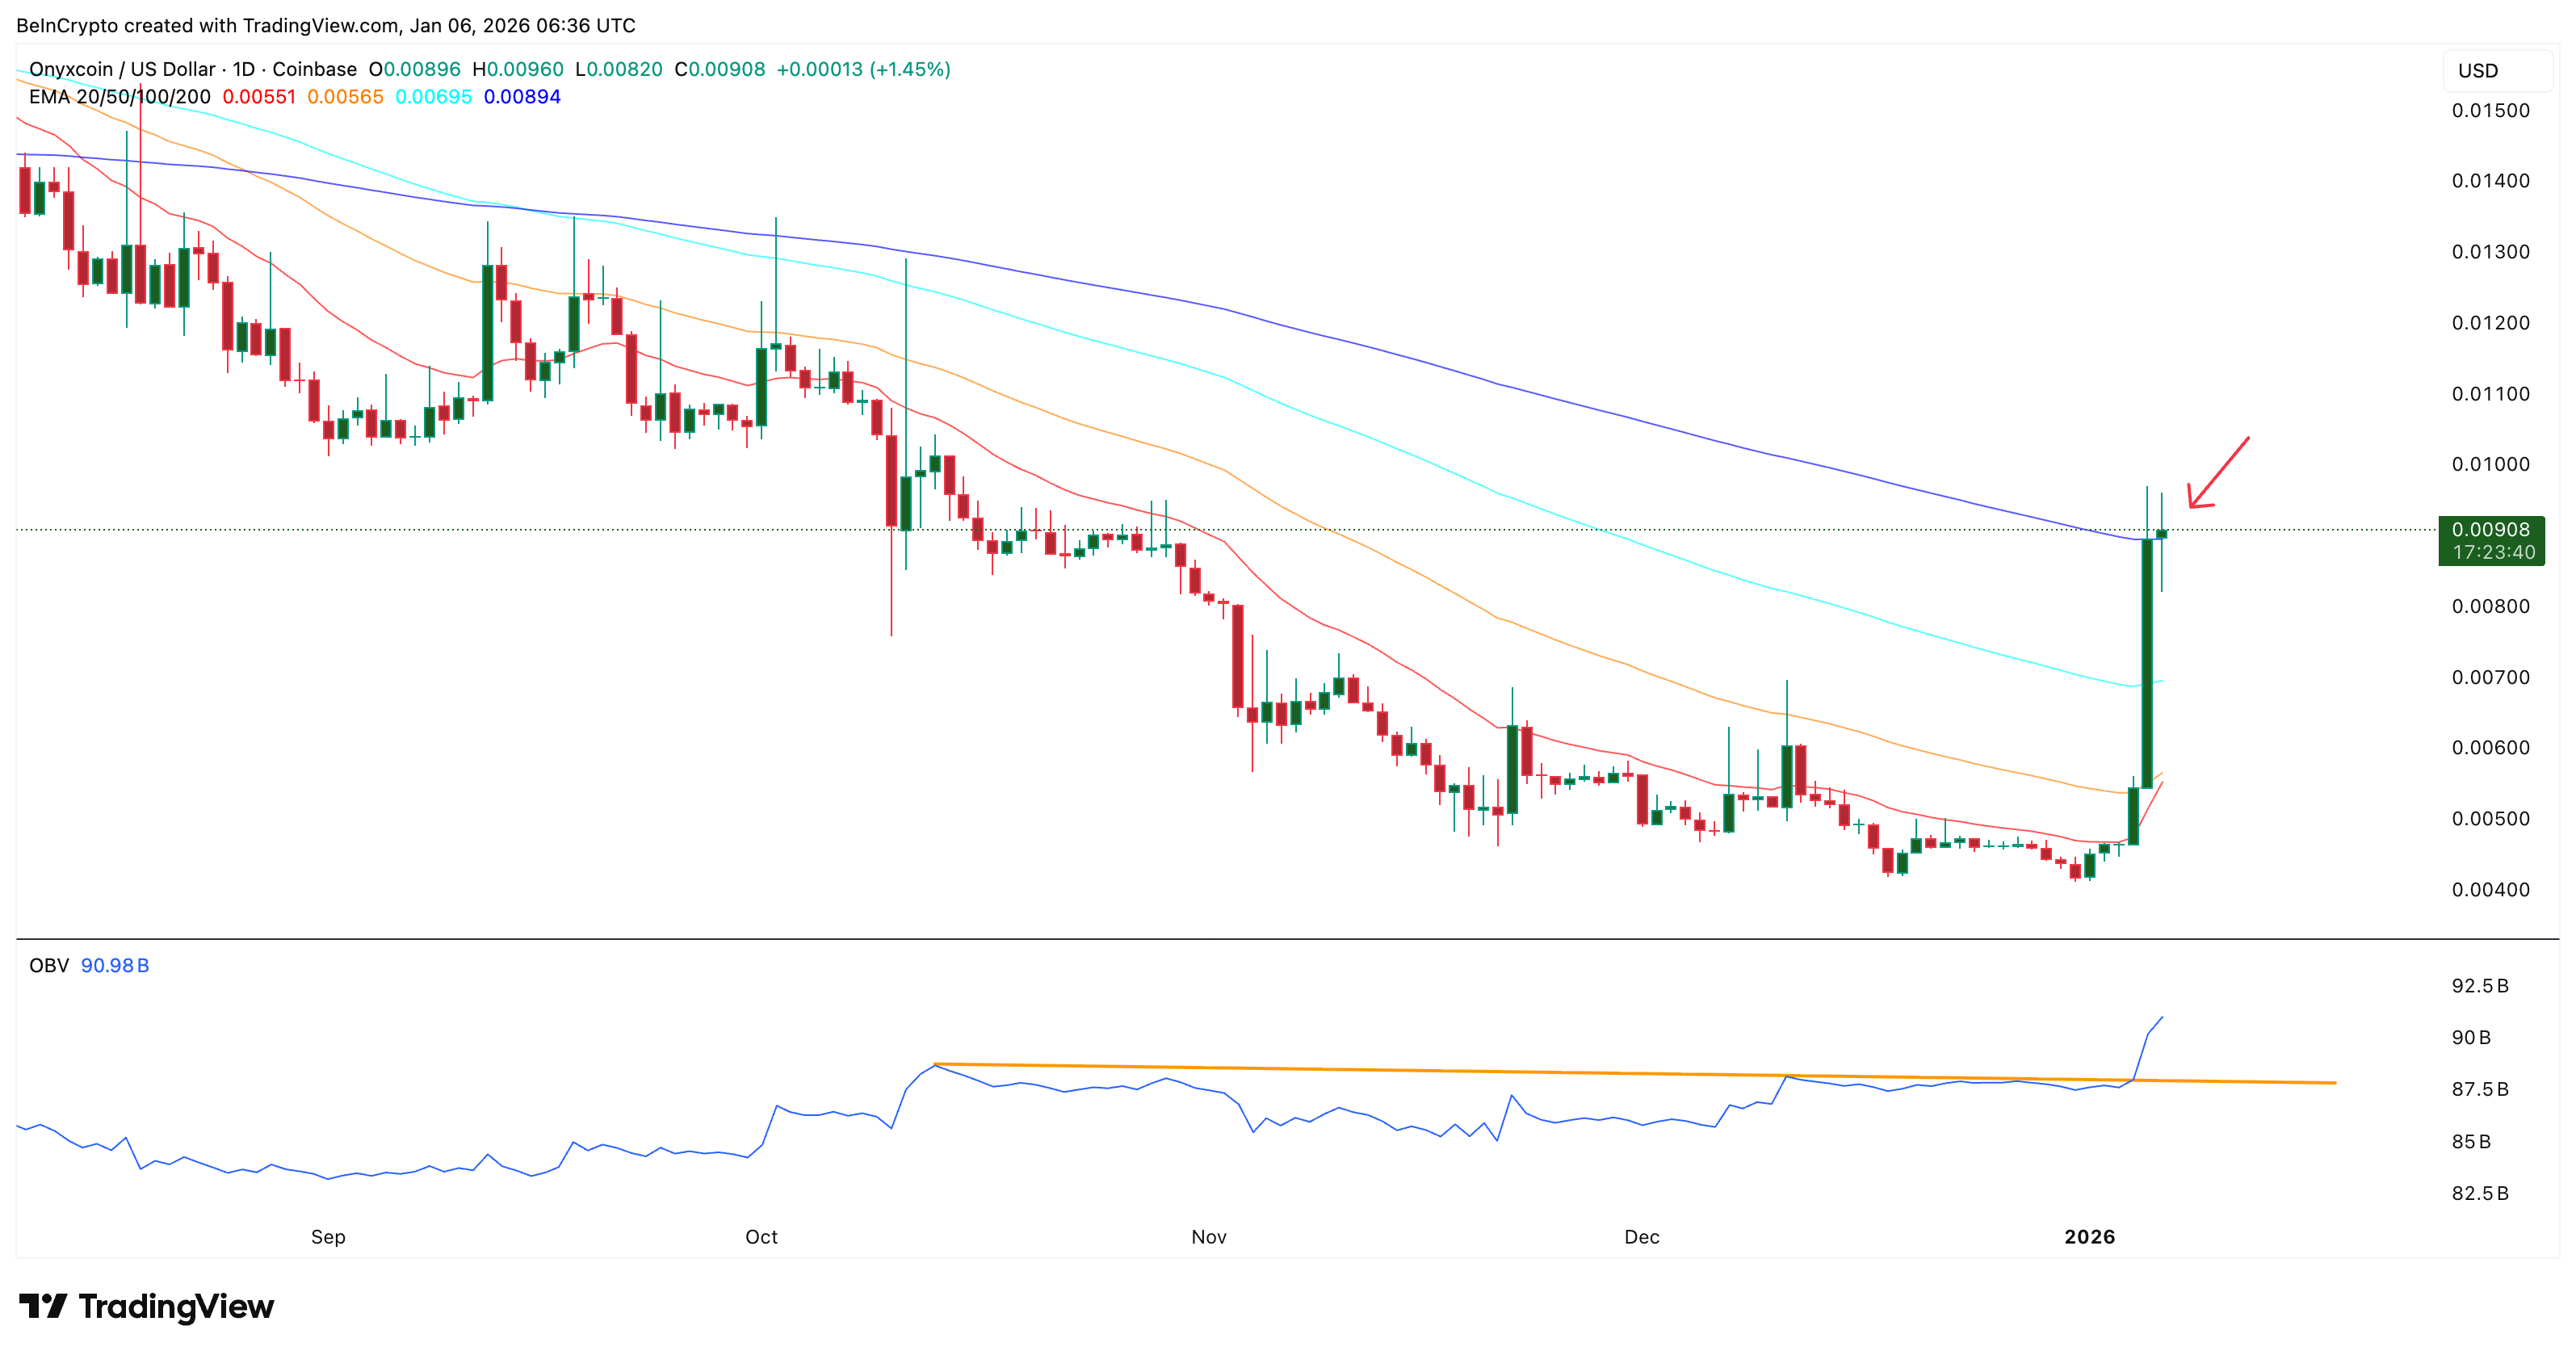
The $XCN price breakout past all the exponential moving average lines did not happen in isolation. On the daily chart, Onyxcoin has pushed above key resistance levels while setting up a potential bullish exponential moving average crossover.
An exponential moving average (EMA) smooths price data while giving more weight to recent moves. When the 20-day EMA approaches and potentially moves above the 50-day EMA, it often signals improving trend strength. $XCN is now close to that crossover, which supports the idea that the broader trend is shifting higher.
Volume confirms this move. On-balance volume (OBV), which tracks whether volume is flowing into or out of an asset, has broken above a long-standing descending trendline. OBV rising alongside price suggests buyers are stepping in with conviction, not just reacting to forced liquidations.
Want more token insights like this? Sign up for Editor Harsh Notariya’s Daily Crypto Newsletter here.
Recent candles also show long upper and lower wicks. This indicates that both buyers and sellers are active, and the price remains at higher levels.
Together, the EMA setup and OBV breakout suggest this rally is supported by spot demand, not just short-term speculation.
Capital Flow Signals Support the Rally, Not a Blow-Off Top
To understand whether larger players are involved, capital flow matters more than price alone.
The Chaikin Money Flow (CMF) indicator helps measure whether money is entering or leaving an asset. When CMF stays above the zero line, it suggests net buying pressure. In $XCN’s case, CMF has trended higher even while the price moved lower between October and early January.

That divergence matters. It shows that capital was quietly flowing in during the downtrend. As price has now broken higher, CMF has remained strong, reinforcing the idea that this rally has backing from real buying, not just momentum chasing.
This alignment between price, OBV, and CMF reduces the odds of a classic bull trap. Strong rallies that fail usually show weakening volume or capital flow. That is not happening here yet.
Derivatives and Onyxcoin Price Levels Define What Comes Next
Leverage-driven rallies often collapse quickly when positioning becomes one-sided. That does not appear to be the case for Onyxcoin right now.
On the $XCN perpetual futures liquidation map, a balance exists between short and long leverage. Cumulative short liquidation sits near $1.58 million, while long liquidation is around $1.36 million. Neither side is overcrowded. This balance reduces the risk of a sharp squeeze reversal and suggests that the market remains orderly.
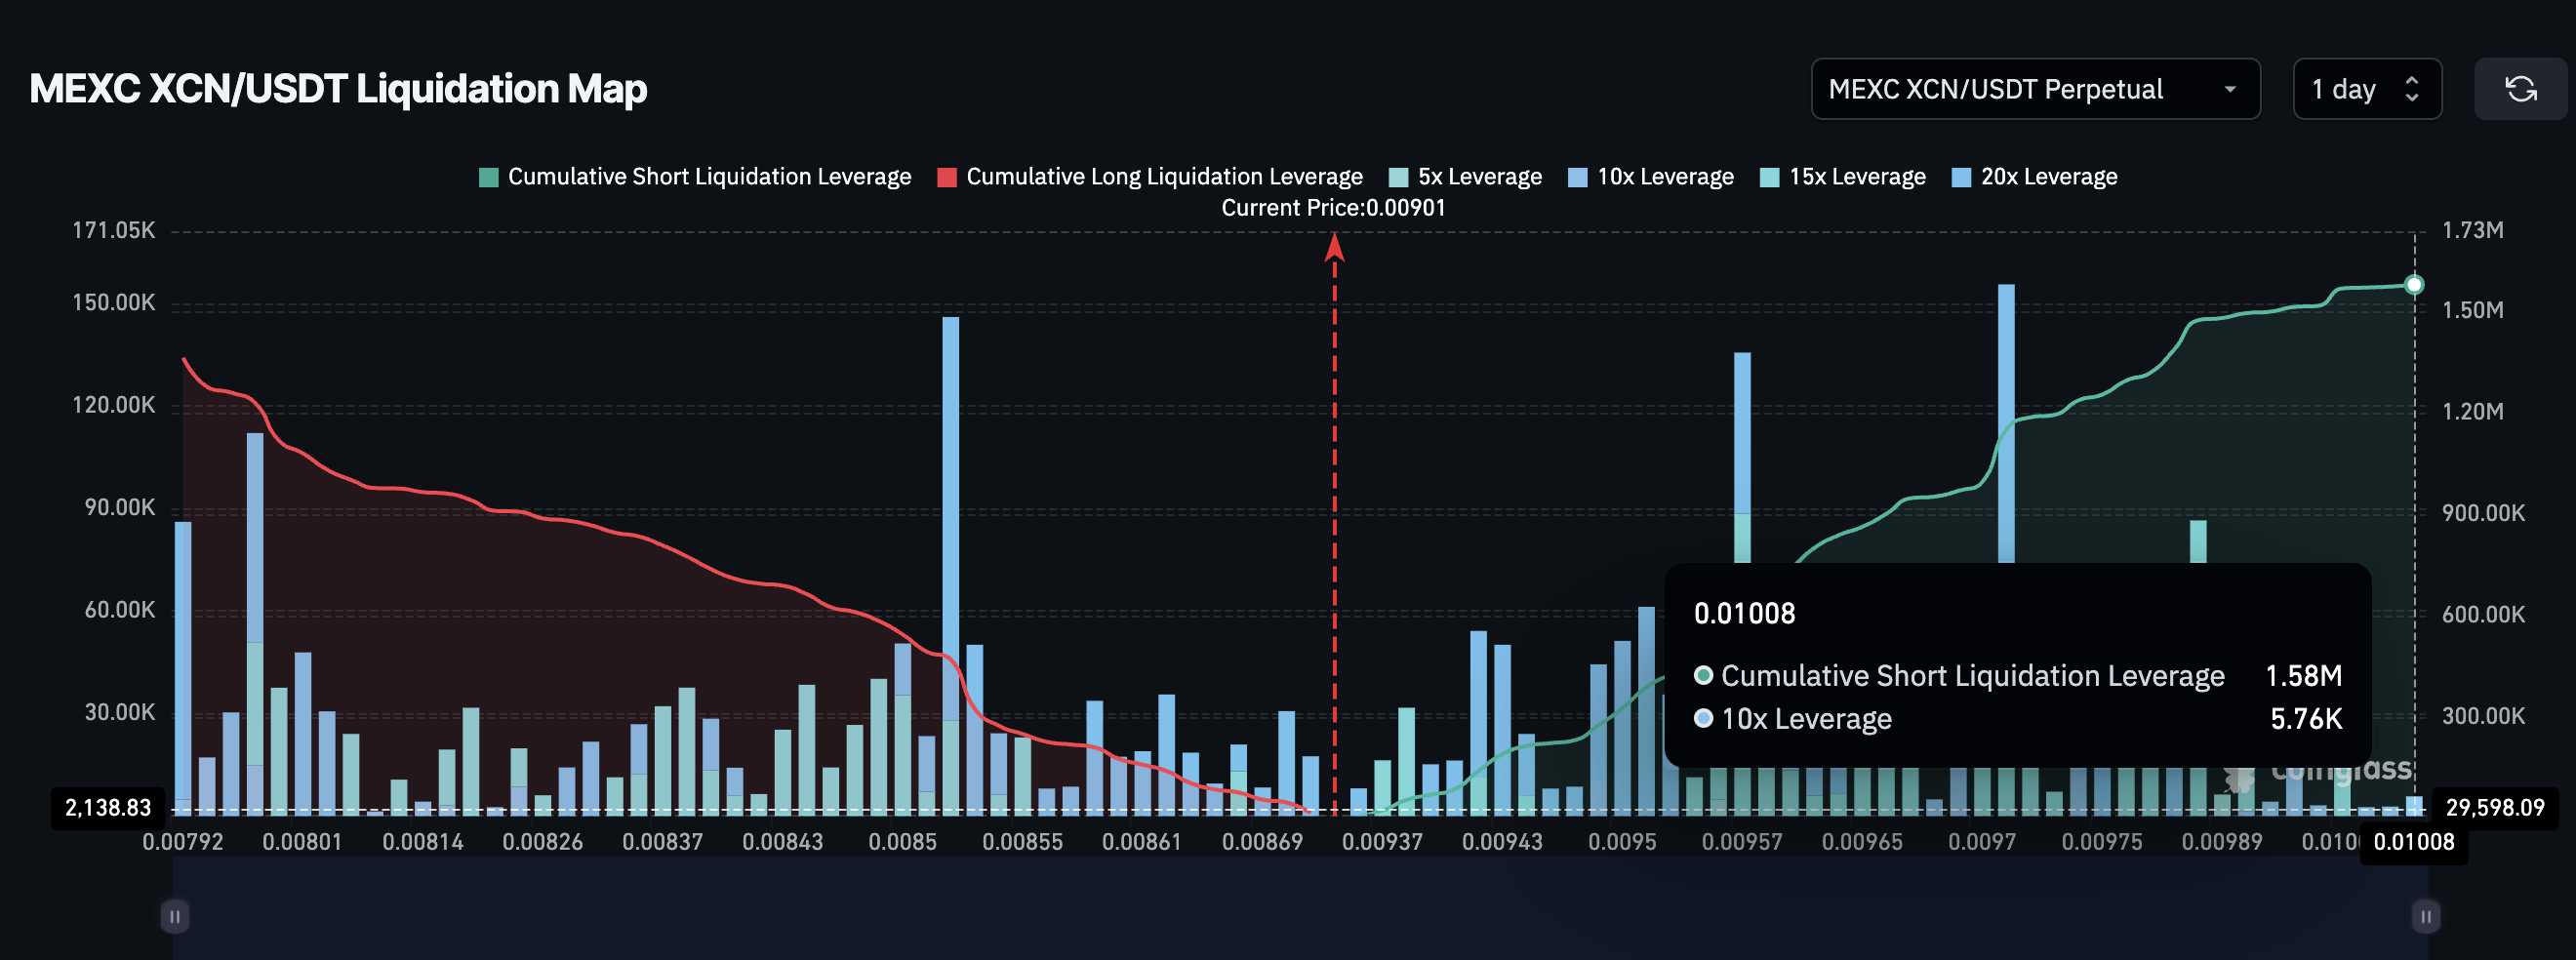 $XCN Leverage Map">
The focus now shifts to price levels.
The Onyxcoin price is currently testing resistance near $0.0095 (after two rejections). A clean break and hold above this level would open the door toward $0.0110, which aligns with Fibonacci extensions and implies roughly 21% upside from current levels.
On the downside, holding above $0.0084 is critical. If that level fails, a fast pullback toward $0.0074 becomes possible, especially if long positions unwind. Even so, that would look more like a reset than a trend failure unless volume and capital flow weaken sharply.
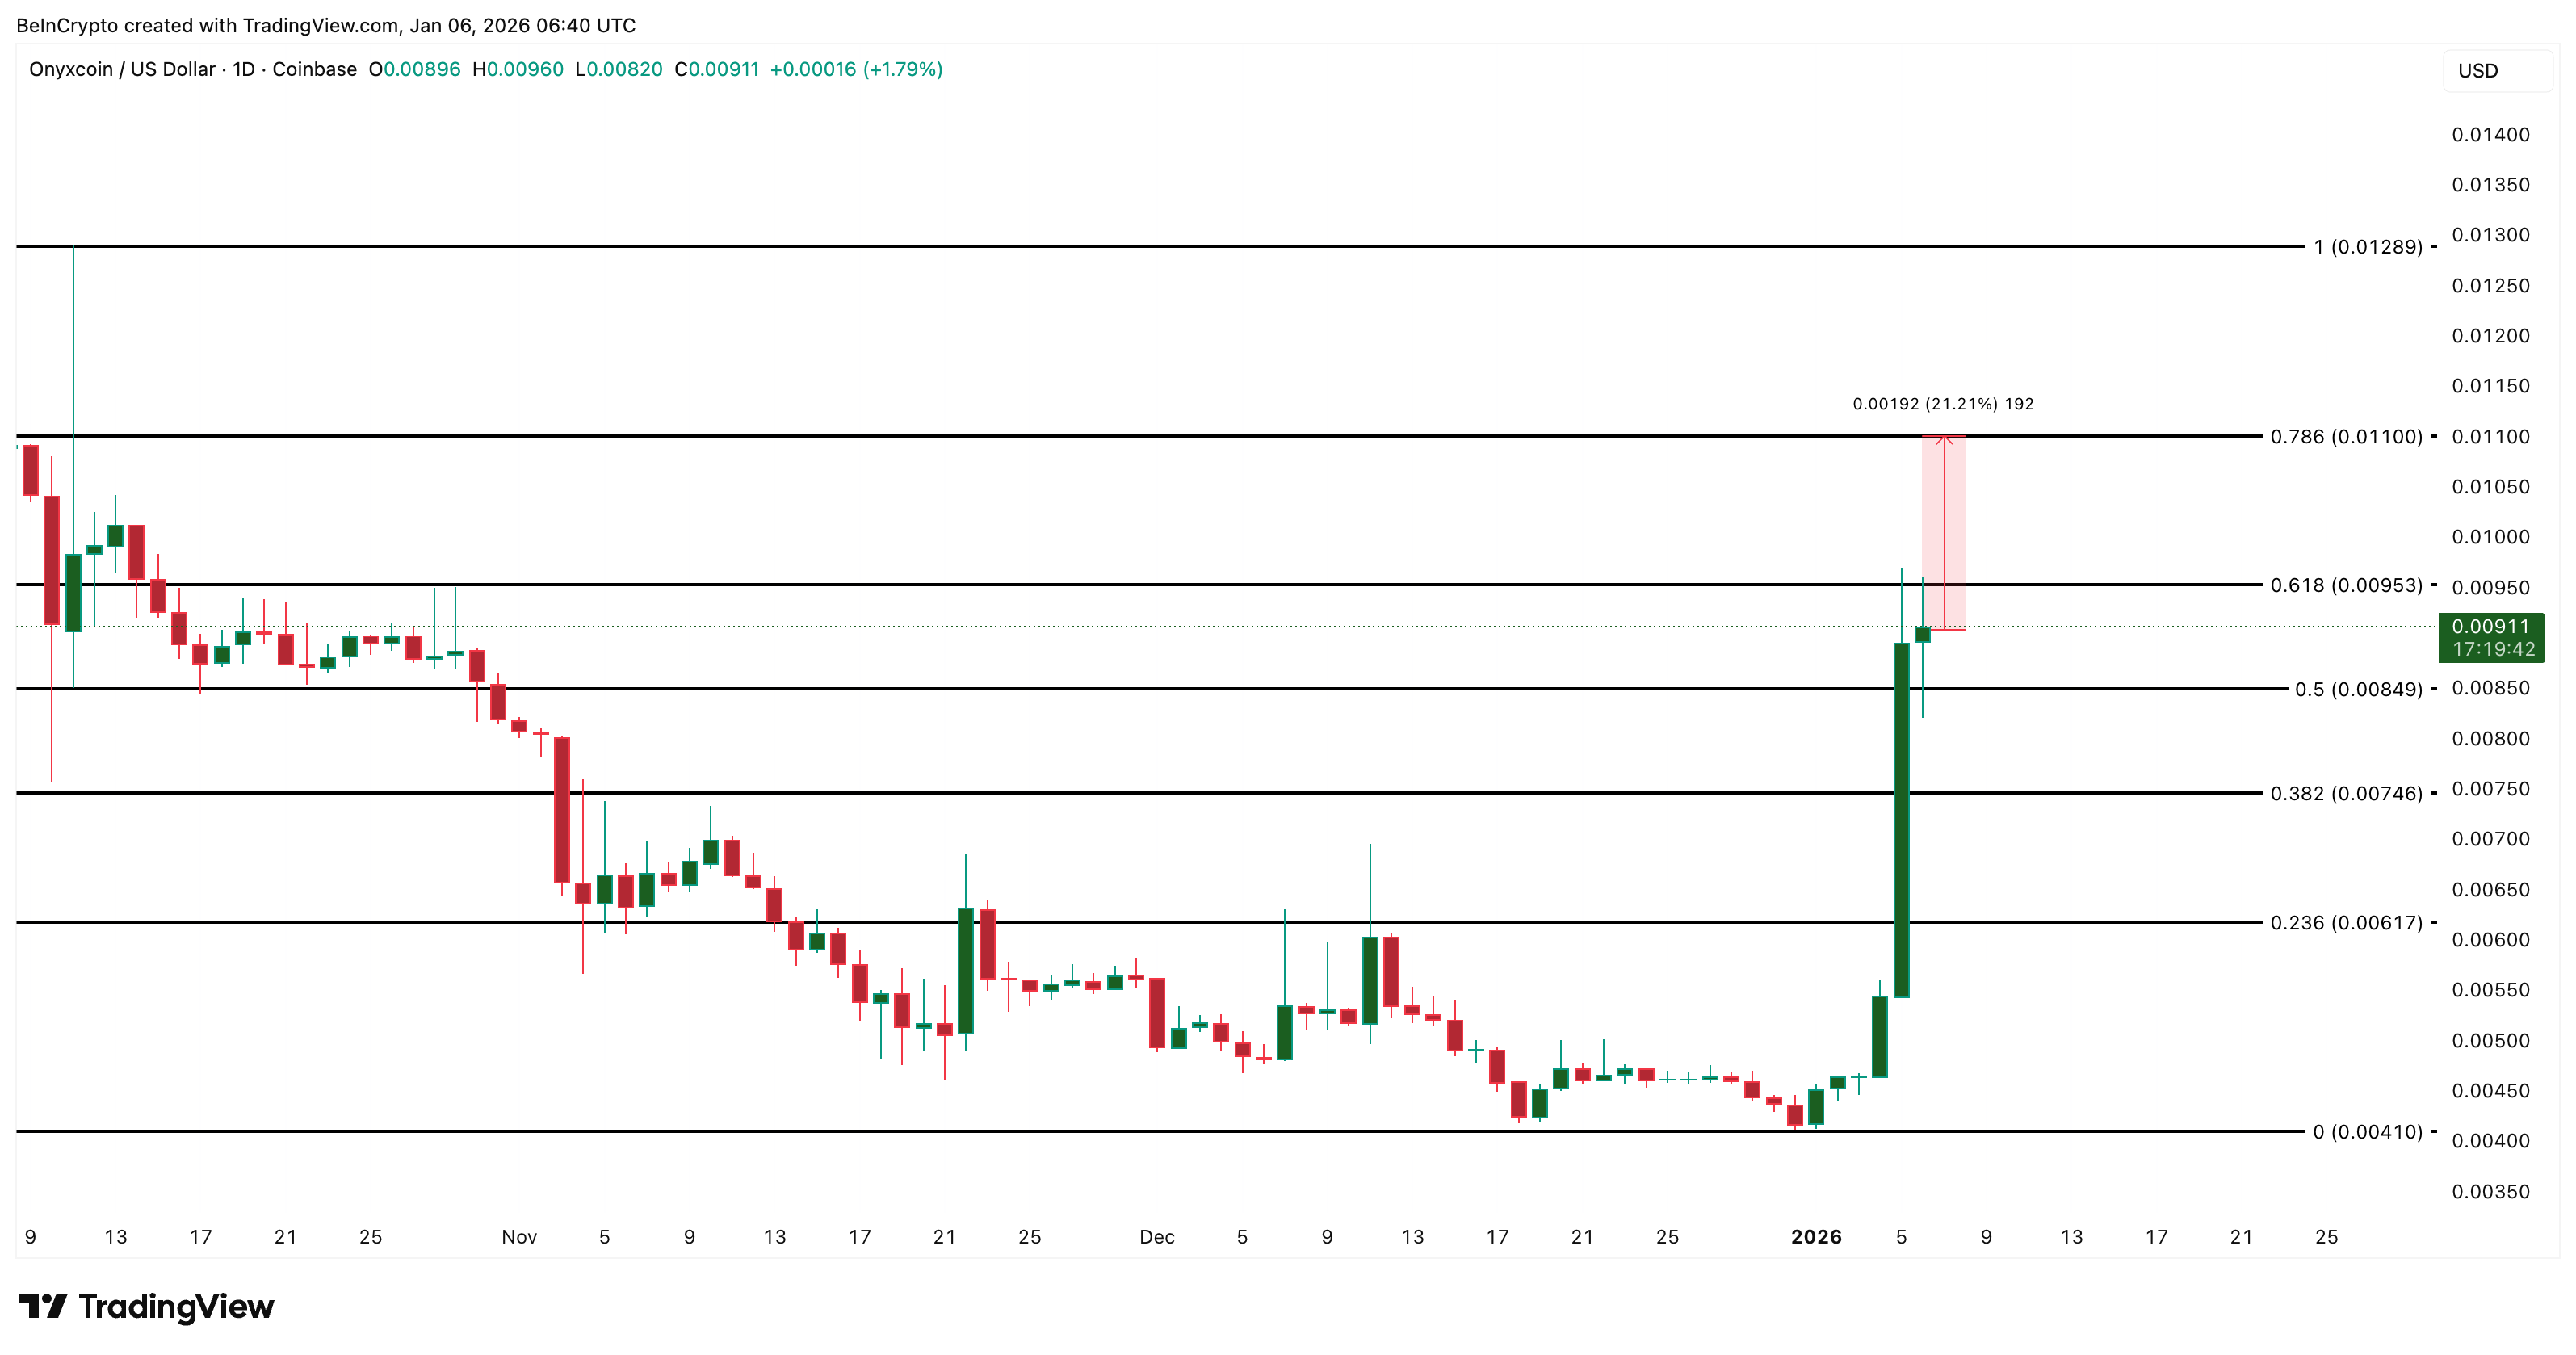
After a 100% weekly rally, caution is natural. For now, $XCN’s charts suggest the move has support. Whether more upside is left in the tank depends on how the price behaves around resistance, not on how far it has already traveled. The key to a bigger surge for the Onyxcoin price now sits at $0.0095.
The post Onyxcoin ($XCN) Price Doubles in a Week — Charts Show More Upside Left in the Tank appeared first on BeInCrypto.