
The Cardano price is up nearly 21% over the past seven days and around 7% in the last 24 hours, making it one of the stronger large-cap movers this week. The rally looks healthy at first glance, supported by improving trend signals on the chart.
But zooming in shows a more mixed picture. While the broader trend still points higher, momentum indicators suggest the move may be cooling. Instead of a sharp pullback, the data now leans toward a range-bound phase forming before the next directional move. Here is how the signals line up.
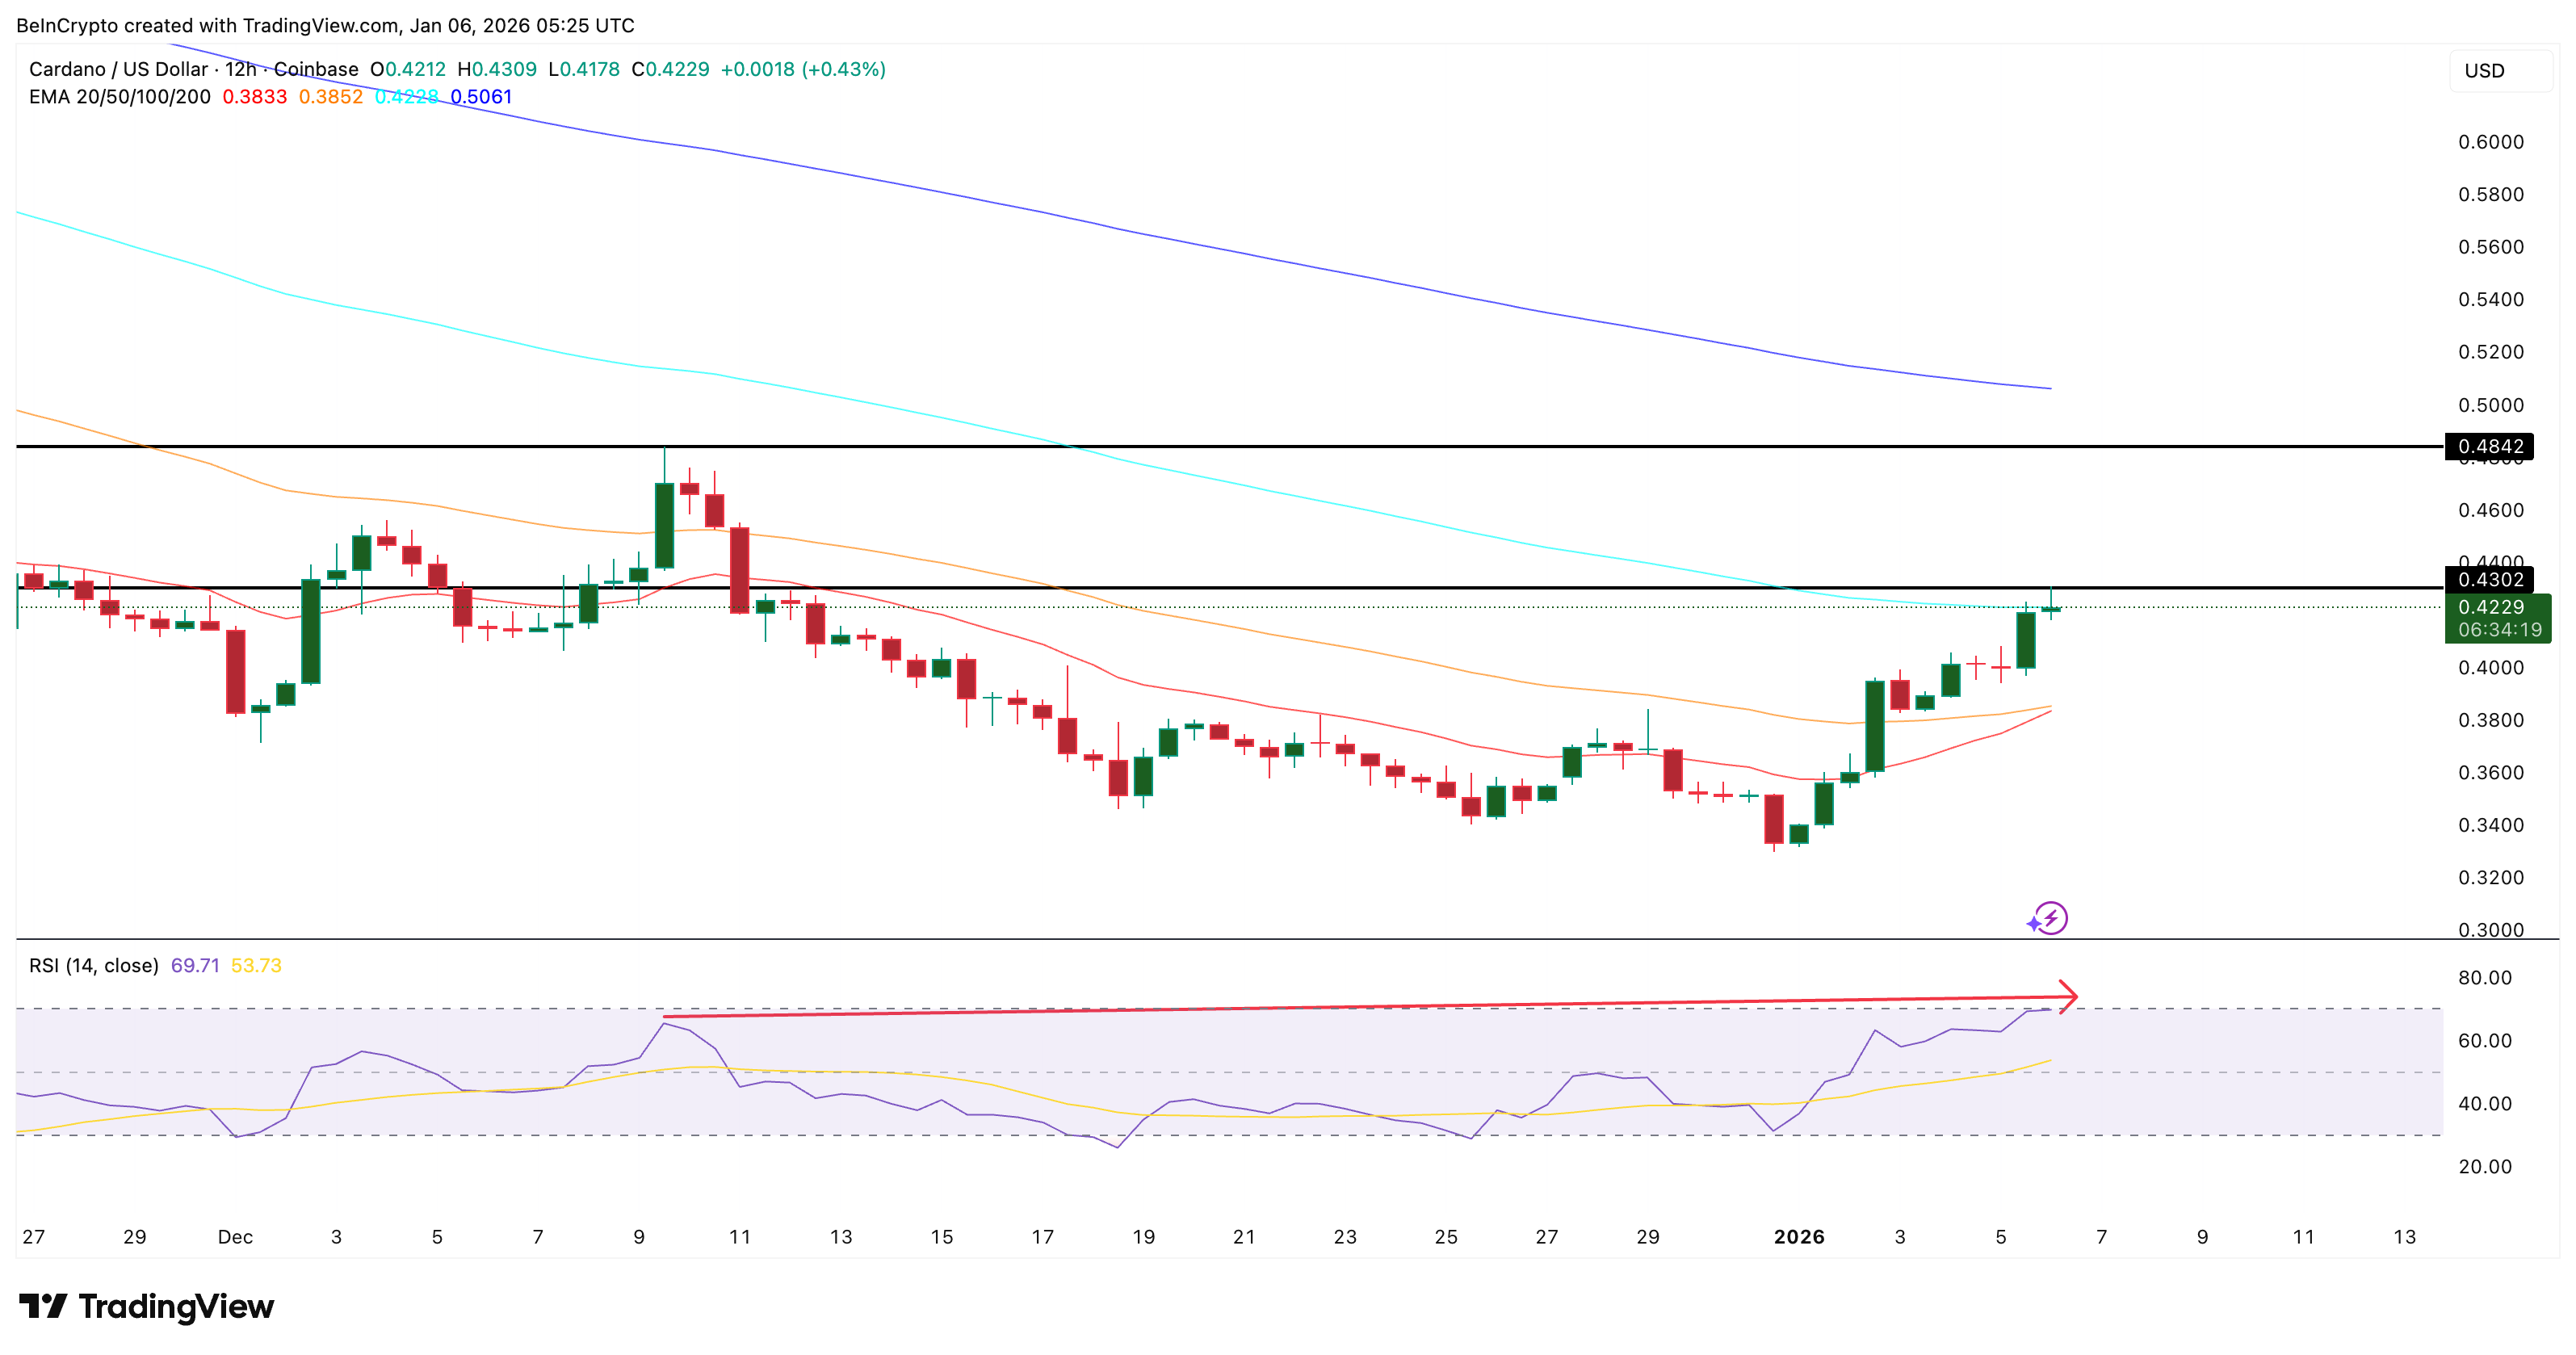
Bullish Trend Holds, But Momentum Is Cooling on the 12-Hour Chart
On the 12-hour chart, Cardano continues to trade within a rising trend structure. One key bullish signal is a looming exponential moving average (EMA) crossover, where the 20-period EMA is closing in on the 50-period EMA.
An exponential moving average smooths price data while giving more weight to recent price action. When a shorter-term EMA moves above a longer-term EMA, it often signals that the trend is strengthening. This setup supports the view that Cardano’s mid-term trend remains bullish.
However, momentum tells a slightly different story.
Between December 9 and January 6, Cardano price trended lower, while the Relative Strength Index (RSI) trended higher. RSI measures momentum. When the price weakens, but the RSI rises, it creates a hidden bearish divergence. This usually signals slowing momentum (often a pullback), not a trend reversal.
Want more token insights like this? Sign up for Editor Harsh Notariya’s Daily Crypto Newsletter here.
If the next Cardano price candle forms under $0.43, it would confirm the lower-high price formation and expand the pullback risk.
In simple terms, the trend is still moving up, but it is doing so with less force. That combination often leads to consolidation rather than continuation or collapse.
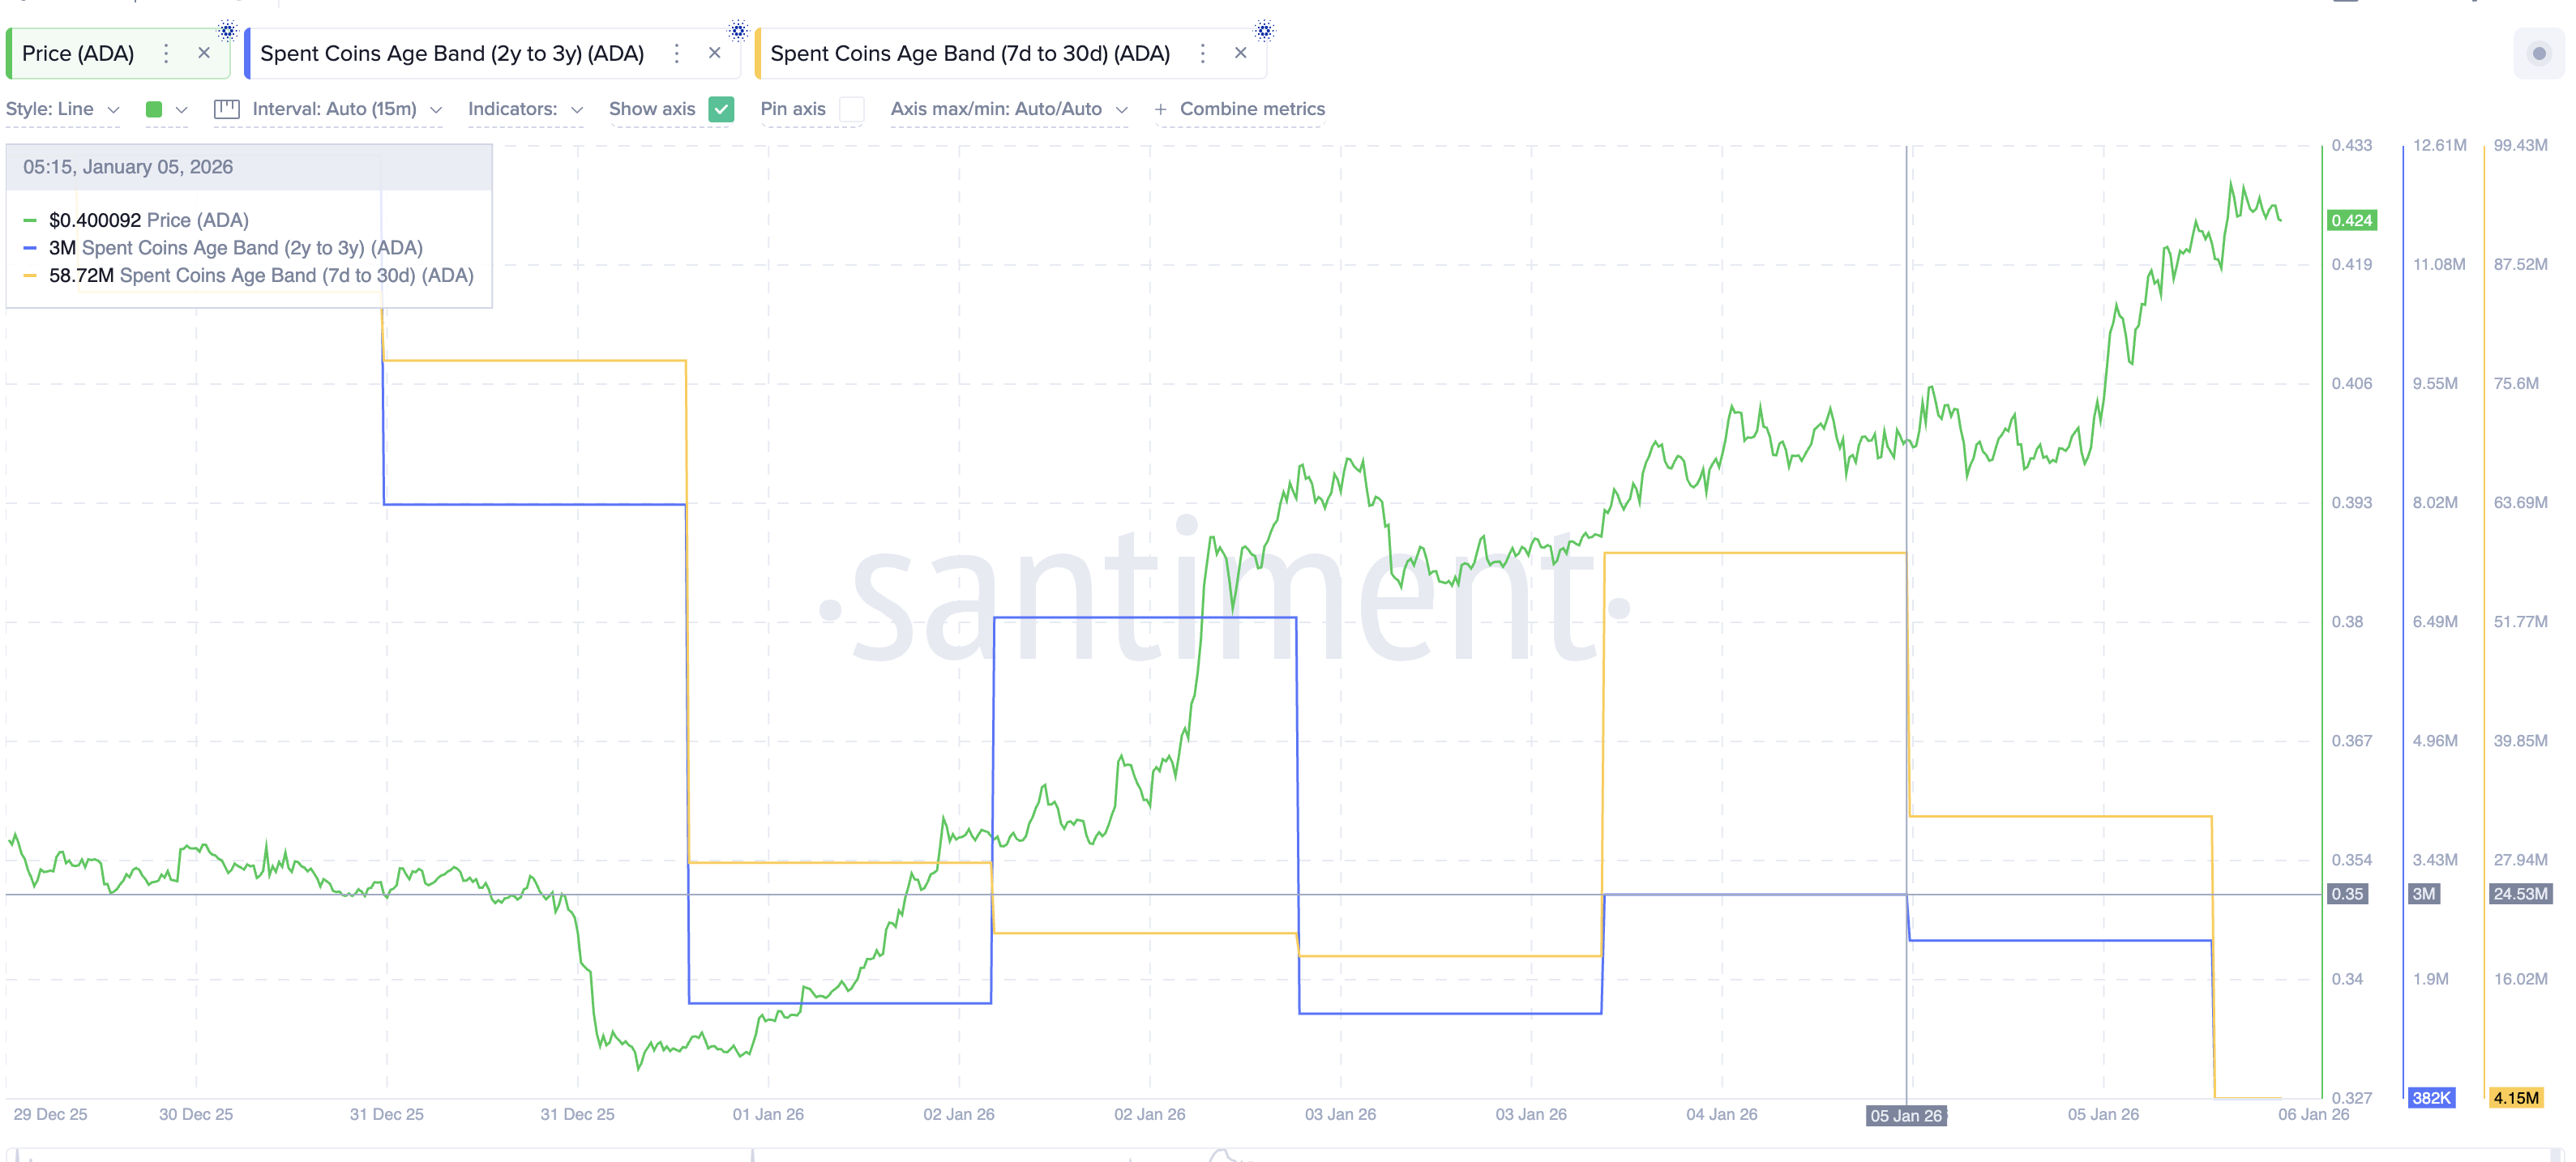
Low Coin Movement Shows Holders Are Patient, Not Panicking
On-chain data helps explain why a deep pullback appears unlikely at present.
Spent Coins Age Bands track how much Cardano is being moved by holders of different time horizons. Rising values mean more coins are being spent or sold. Falling values mean holders are staying put.
Two important groups stand out.
Coins held by short-term $ADA holders (7–30 days) saw spending drop sharply, from about 58.7 million $ADA to just 4.1 million $ADA, an 87% decline over the past 24 hours. At the same time, coins held by very long-term holders (2–3 years) fell from roughly 3 million $ADA to about 382,000 $ADA, a 93% drop.
 $ADA Coin Activity Slows Down">
This tells a clear story. Both short-term traders and long-term investors are choosing patience. There is no sign of panic selling or aggressive profit-taking, even after a strong weekly rally.
When momentum cools, but coin movement stays low, markets often shift sideways, in a range, instead of breaking down.
Cardano Price Levels Point to a 9% Range
With trend strength and momentum cooling colliding, price levels now matter most.
The Cardano price needs to hold above $0.39 to keep the bullish structure intact. That level acts as near-term support. If price slips below it, a deeper pullback toward $0.33 becomes possible.
On the upside, the key level to watch is $0.43. A clean break and hold above that zone would invalidate the bearish divergence for now and allow momentum to rebuild. If that happens, Cardano could target $0.48 next, with a longer-term path toward $0.60 if strength accelerates.
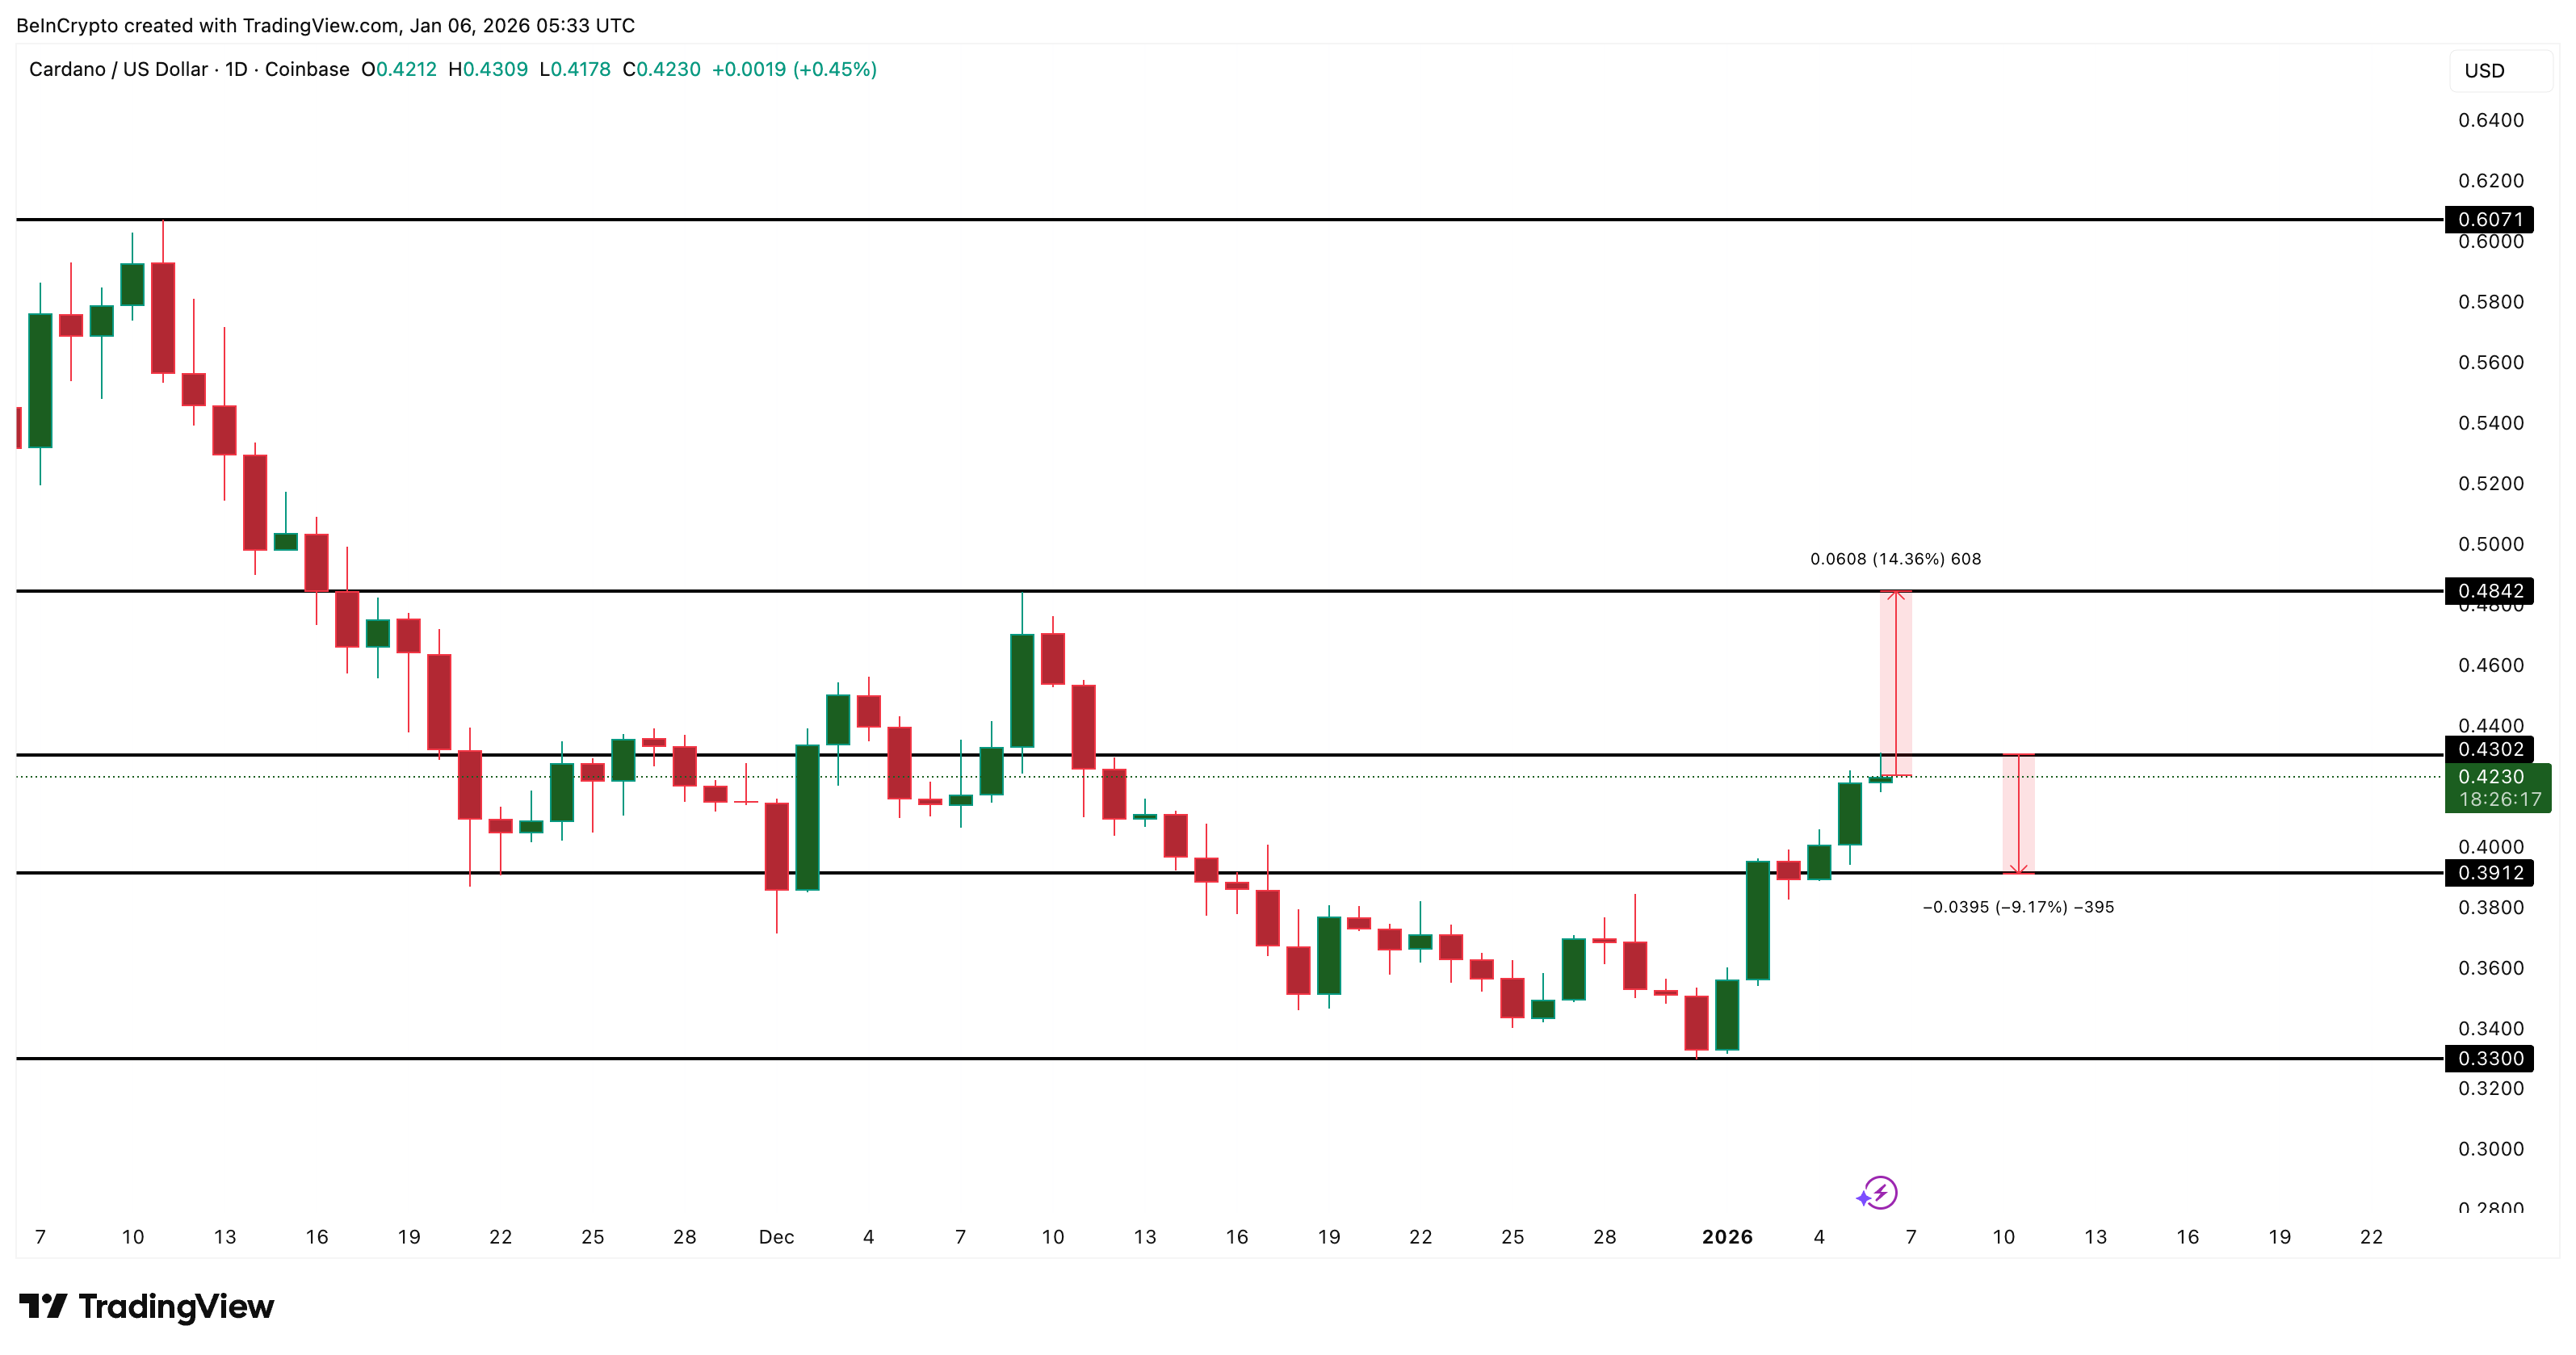
Until one of those levels breaks, the most likely outcome is a range between $0.39 and $0.43, which represents roughly a 9% trading box.
That range fits the current data. The trend remains bullish; holders are not selling, but momentum needs time to reset.
The post Cardano Price Rally Tiring Out? Charts Show A 9% Range Risk appeared first on BeInCrypto.