
- Stacks price rose 12% to near $0.38 as Bitcoin flipped green.
- The layer-2 token could surge to $0.56 and target higher levels if $BTC extends gains.
- Bulls may, however, face a pullback as RSI hits overbought conditions.
Several altcoins, including Stacks, soared amid Bitcoin’s impressive rally on Monday. Ethereum and XRP also rose to key levels.
While $BTC pumped to above $93,800, the impact was for buoyed altcoins such as Stacks to spike to multi-week highs.
As the flagship digital asset looks to hold onto the gains, the layer-2 solutions Stacks is off intraday highs and eyeing a key price level.
Volume spikes hint at buying pressure for $STX.
Stacks price jumps 12% to above $0.37
On January 5, 2026, $STX surged by over 12%, outperforming many peers in the altcoin space.
This upward movement coincided with Bitcoin’s push toward $94,000.
$BTC came close to the mark as buyers touched intraday highs of $93,972 across top crypto exchanges.
Meanwhile, $STX also briefly toyed with highs near $0.38 amid broad market optimism.
Traders see Stacks as a “Bitcoin beta” play, where movements in $BTC often lead to outsized returns.
Utility for DeFi, NFTs, and scalable applications that are secured by Bitcoin’s network see several such tokens appeal to investors.
$BTC onchain never worked for institutions due to hard tradeoffs.
That’s no longer the case.
Stacks integrations and upgrades changed the setup.
Here are 7 reasons institutions are now deploying $BTC via Stacks. 🧵 ⬇️ pic.twitter.com/ikGxkv8kBV
— The Advisor.btc 🟧 (@theadvisorbtc) December 31, 2025
Stacks price forecast: channel breakout sees bulls eye $0.56
The $STX token has extended its recent advance following a technical breakout from a long-standing descending channel that had defined its price action for several months.
The channel, characterised by a series of lower highs and lower lows, has been in place since the token peaked in May 2025, reflecting sustained bearish control.
During this period, $STX largely traded below its 50-day simple moving average, reinforcing the downtrend.
The latest move above the upper boundary of the channel, however, has also pushed the token above its 50-day SMA, a development that suggests a potential shift in short-term momentum.
Analysts note that this breakout opens the door to a retest of the $0.56 level, which coincides with the extension of the broader downtrend line from the May 2025 high.
That area is viewed as technically significant, having previously marked the zone of a sharp 27% decline during the October 10, 2025 market sell-off, and could act as a key test of bullish conviction going forward.
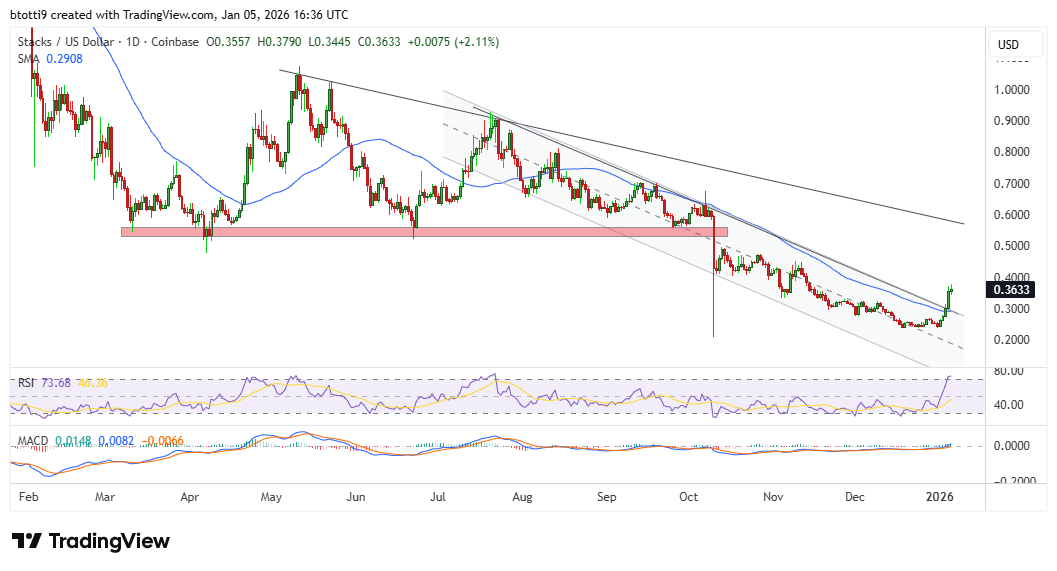
On the daily chart, the Moving Average Convergence Divergence (MACD) indicator continues to point to improving momentum, reinforcing the near-term bullish bias as long as buying interest remains dominant.
That said, the setup also carries signs of overheating. The daily Relative Strength Index (RSI) has moved into overbought territory, suggesting the rally may be vulnerable to a pause or reversal.
Under these conditions, Stacks could see a period of consolidation or a sharper pullback if traders begin locking in profits.
In the event of renewed selling pressure, analysts flag the $0.30 level as initial support, with a deeper retracement potentially testing the $0.24 area.