Despite an underwhelming 2025, a strong start to the year, accompanied by positive chart development, puts Shiba Inu in a bullish position.
Shiba Inu retraced 67% last year, a move that negated the historically bullish price action seen in the Bitcoin post-halving year. However, an admirable start to 2026 has raised bullish sentiments among market observers.
For context, $SHIB is up 27% from its opening price of $0.00000691 this year. It rallied to a high of $0.0000094 in the first week of 2026, bringing its price closer to the previously lost psychological level at $0.000010.
Shiba Inu Weekly Chart Looks Good
Amid this uptick, analyst Charting Guy is among the market watchers who see positive price action in store for Shiba Inu. He highlighted in his January 4 tweet that the prominent meme coin looks good on the weekly timeframe.
His analysis coincided with a strong weekly candle formation for $SHIB. The token ended the week with an impressive 22% rise, setting it up for further bullish price developments.
Notably, an accompanying chart shows that the price increases place $SHIB close to the tip of a multi-month descending trendline. The neckline resistance originated from a high of $0.0000334 in December 2024 and has since suppressed the meme coin’s price.
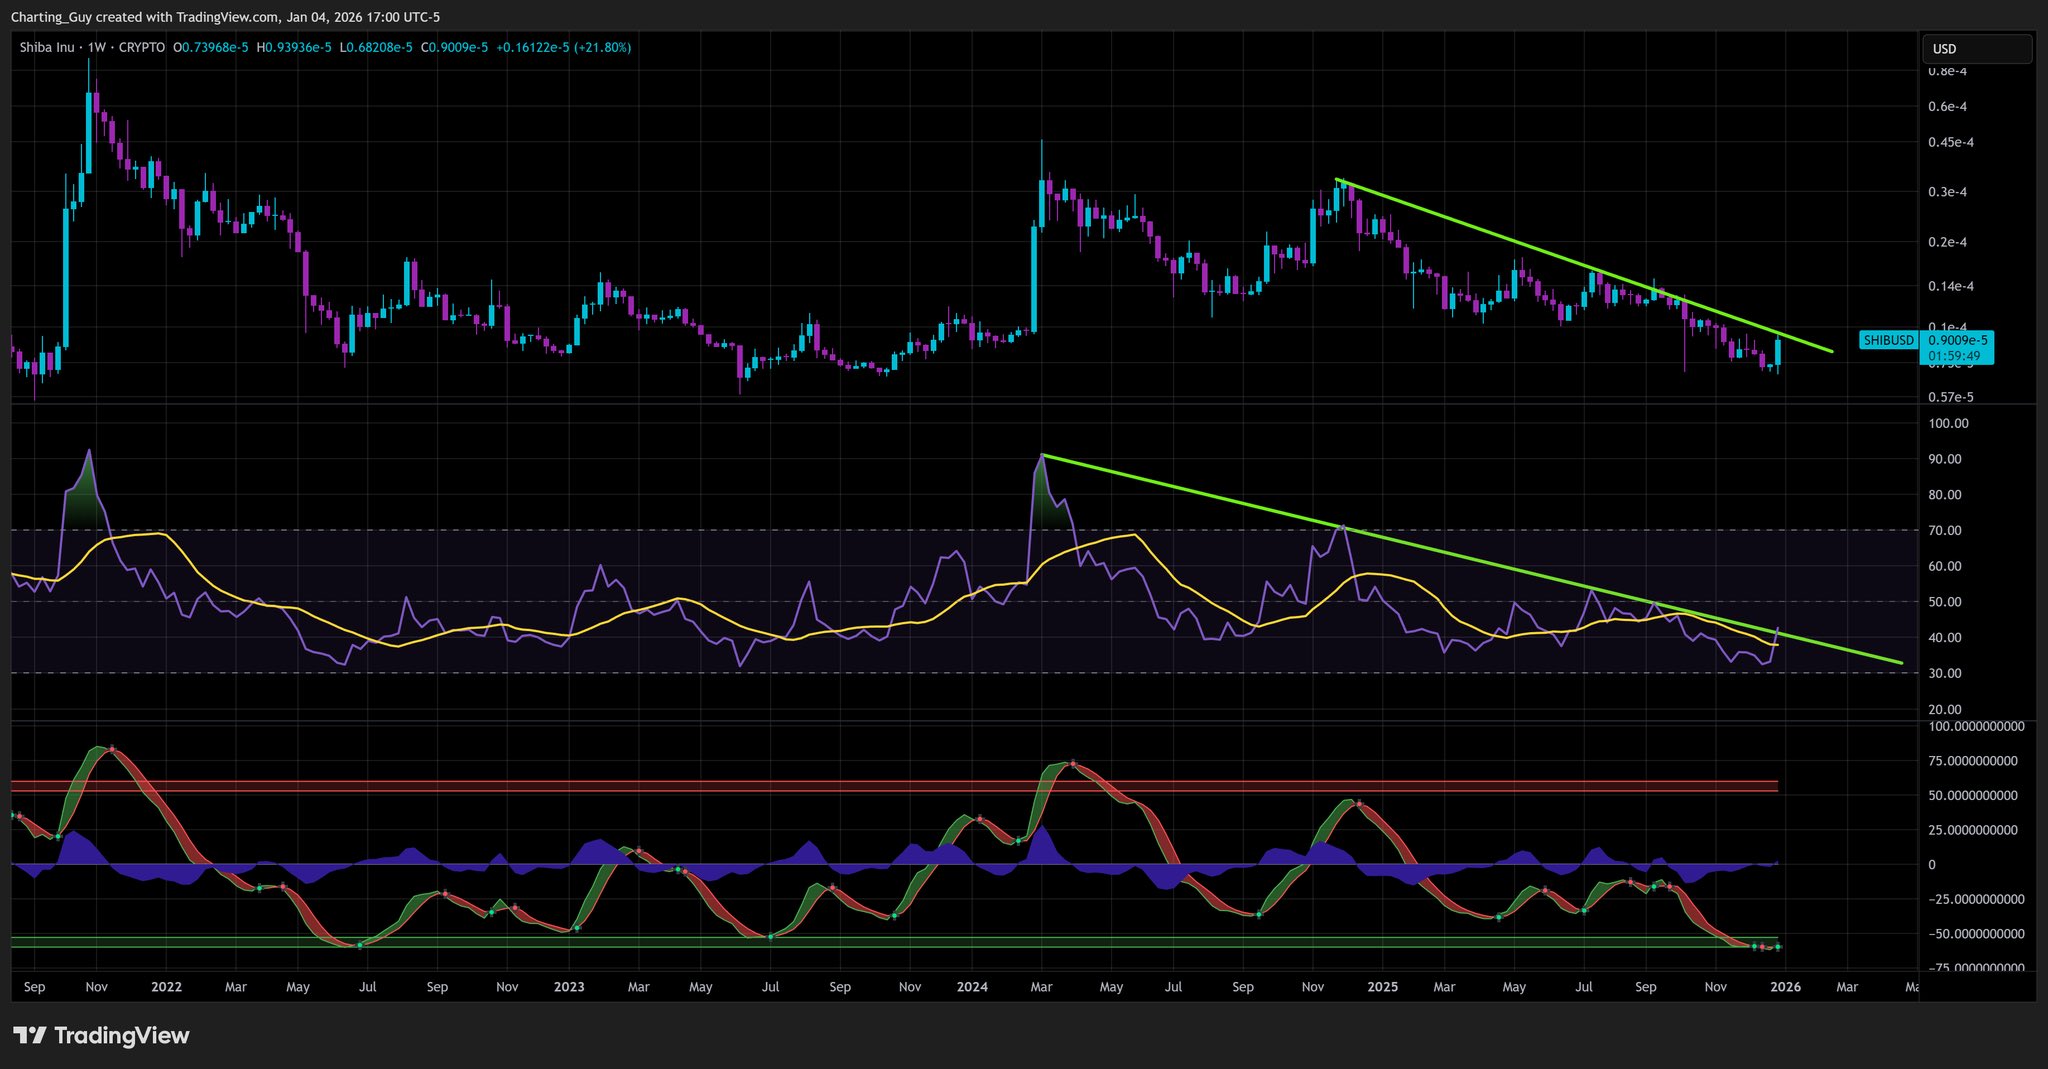
Shiba Inu trading near the tip of the trendline increases the likelihood of a breakout. If this happens, then last week’s rally might just be a glimpse of what is on the horizon for the Shiba Inu price.
Aligning RSI Adds Bullish Sentiment
Remarkably, the weekly relative strength index (RSI) seems to be following a similar pattern, strengthening the optimistic sentiment. The indicator has also been trending below a descending resistance trendline for several months.
Specifically, this started around an RSI of 90 when $SHIB soared to a high of $0.0000456 in March 2024. The trendline has prevented a breakout, with attempts in December 2024 and multiple times between July and October 2025 to defy the resistance proving abortive.
However, with a recent trend slightly above the resistance, per the accompanying chart, Shiba Inu could finally be ready to make a decisive move. This, along with the potential price breakout, supports Charting Guy’s sentiment that $SHIB appears poised for an impulsive rally if the current momentum persists.
Meanwhile, if the breakout occurs, the first natural target is a retest of the December 2024 high of $0.0000334, representing a 282% increase from the current market price of $0.00000874.
Interestingly, other analysts have higher price targets. For instance, Crypto Patel predicts a rally to retest its current all-time high of $0.0000885, citing a repeating pattern that sparked that move in 2021.