
Dogecoin traders are watching whether $DOGE can maintain support and break through its latest resistance.
Dogecoin ($DOGE) is once again testing traders’ patience, as price action softens and momentum fades. $DOGE is currently trading around $0.1232, posting a 2.6% decline over the past 24 hours and sitting near the lower end of its daily range between $0.1222 and $0.127.
This steady intraday bleed suggests sellers remain in control, with immediate support forming near the $0.122 zone. A sustained break below this level could expose Dogecoin to further downside, while buyers appear cautious about stepping in aggressively at current prices.
On the higher timeframes, $DOGE continues to struggle, falling 5.7% over the past 7 days and 4.5% in the last 14 days. These declines highlight a lingering bearish trend rather than a brief pullback, reinforcing the market’s risk-off tone toward meme coins.
Key Cardano Levels to Defend
On the 4-hour chart, $DOGE is hovering just below the Bollinger Bands’ midline (20-SMA) around $0.1239. This mid-band now acts as immediate resistance, while the upper Bollinger Band near $0.1264 represents a stronger resistance zone where prior rebounds have stalled. As long as the price remains below this range, upside attempts will likely remain capped.
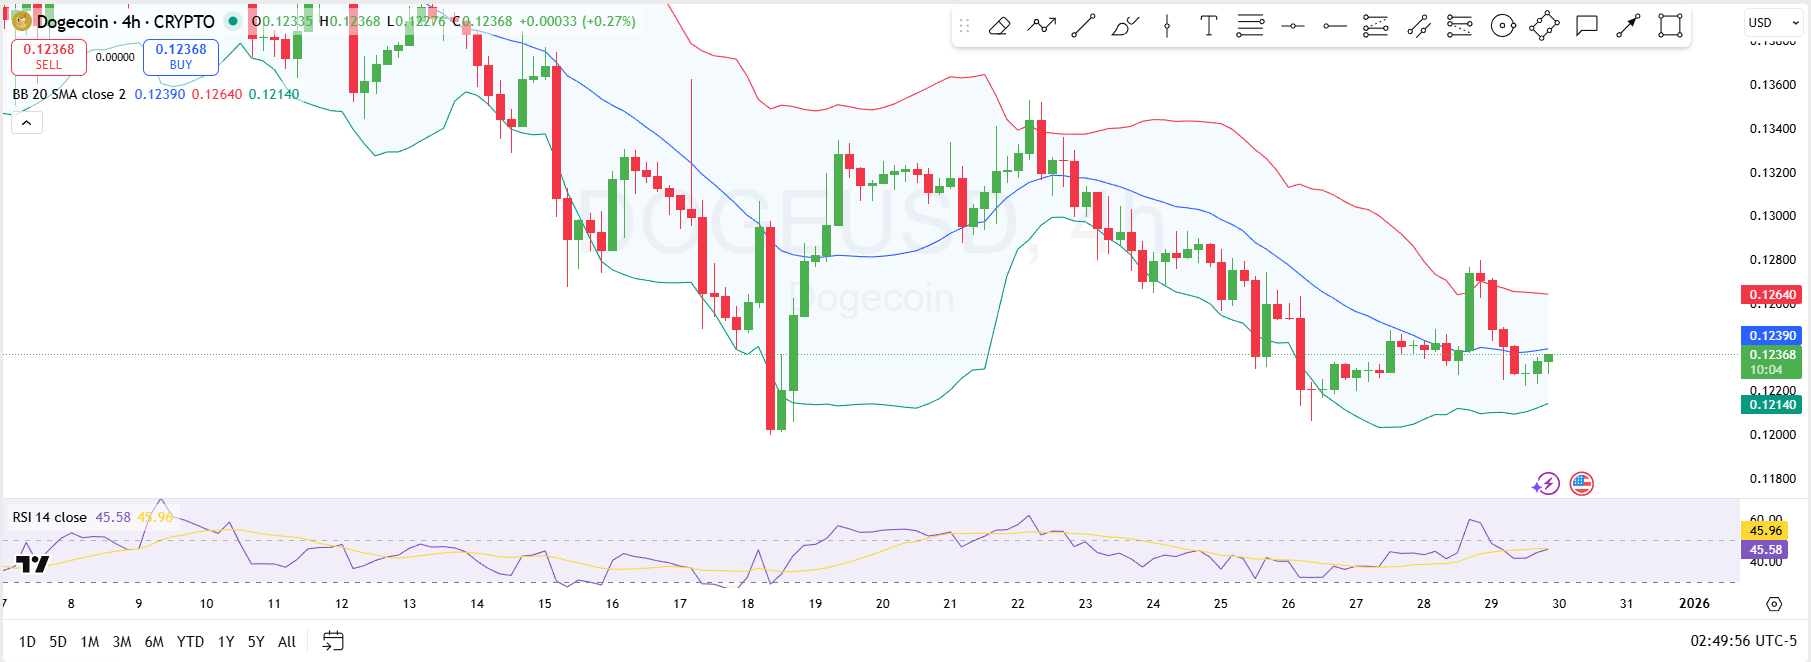
On the downside, key support is forming near the lower Bollinger Band around $0.1214, which has repeatedly cushioned price declines. A breakdown below this level could expose $DOGE to further downside toward the $0.120 psychological area.
Momentum indicators remain neutral-to-weak, with the RSI hovering around 45.58, signaling neither oversold nor overbought conditions but confirming a lack of strong buying pressure. However, the RSI line has crossed above the signal line and is approaching the neutral zone, signaling a potential positive shift for the largest meme coin by market cap.
Ultimately, for Dogecoin to improve its short-term outlook, bulls must defend the $0.121–$0.122 support zone. It must also reclaim resistance near $0.1248–$0.126 to shift momentum back in their favor.
Dogecoin Case Scenarios: Analyst
On the commentary end, Trader Tardigrade highlights that Dogecoin is forming a Descending Triangle pattern on the daily chart, with a support trendline around the $0.122 level. This support has been tested multiple times, while the resistance is sloping downward, tightening the range.

The analyst suggests two potential scenarios: if Dogecoin breaks above the resistance line, it could target the $0.13 range, indicating a bullish breakout. On the other hand, a break below the $0.122 support could lead to a move down toward the next support around $0.118. To reach $0.118 from the current price of $0.1232, $DOGE would fall approximately 4.14%.