The magnitude and consistency of this negative netflow point toward genuine accumulation rather than simple wallet transfers. Market participants preparing to liquidate positions would normally increase exchange deposits, not reduce them. The opposite is occurring.
Selling pressure is diminishing at present valuation levels. Traders willing to offload tokens at current prices are becoming scarcer. This shift in supply dynamics creates a different market structure than what existed during heavier selling periods.
The data does not guarantee an immediate price surge. However, it fundamentally alters the supply side of the equation. Less available inventory on exchanges means fewer tokens positioned for quick sales.
Technical Indicators Show Compression Phase
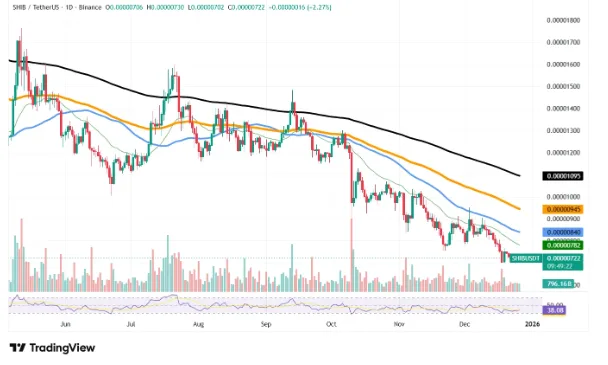
Price charts reflect a market in transition rather than active bullish momentum. $SHIB continues to trade below key moving averages and remains within an established downtrend. Yet the angle of that downtrend has flattened considerably.
Recent price action displays compression characteristics. Volatility has contracted. Lower lows have become infrequent. Momentum indicators rest in oversold zones without triggering panic-driven selloffs.
$SHIB/USDT Chart by TradingView
This technical setup resembles late-stage bearish exhaustion. The pattern suggests selling pressure has largely run its course without yet establishing clear bullish conviction. Markets often consolidate in this manner before directional moves emerge.
The combination of reduced exchange supply and technical compression creates asymmetric potential. Downside risk appears limited by exhaustion selling. Upside potential increases because less supply stands ready to meet any demand surge.
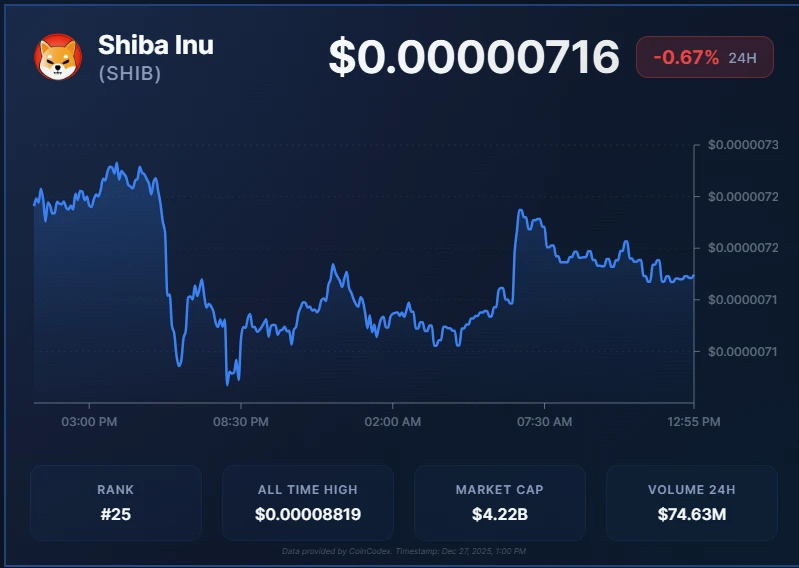
At the time of writing, $SHIB trades at around $0.00000716, suggesting a 0.67% decline in the last 24 hours.
$SHIB’s price action over the past 24 Hours (Source: CoinCodex)

 coinpaper.com