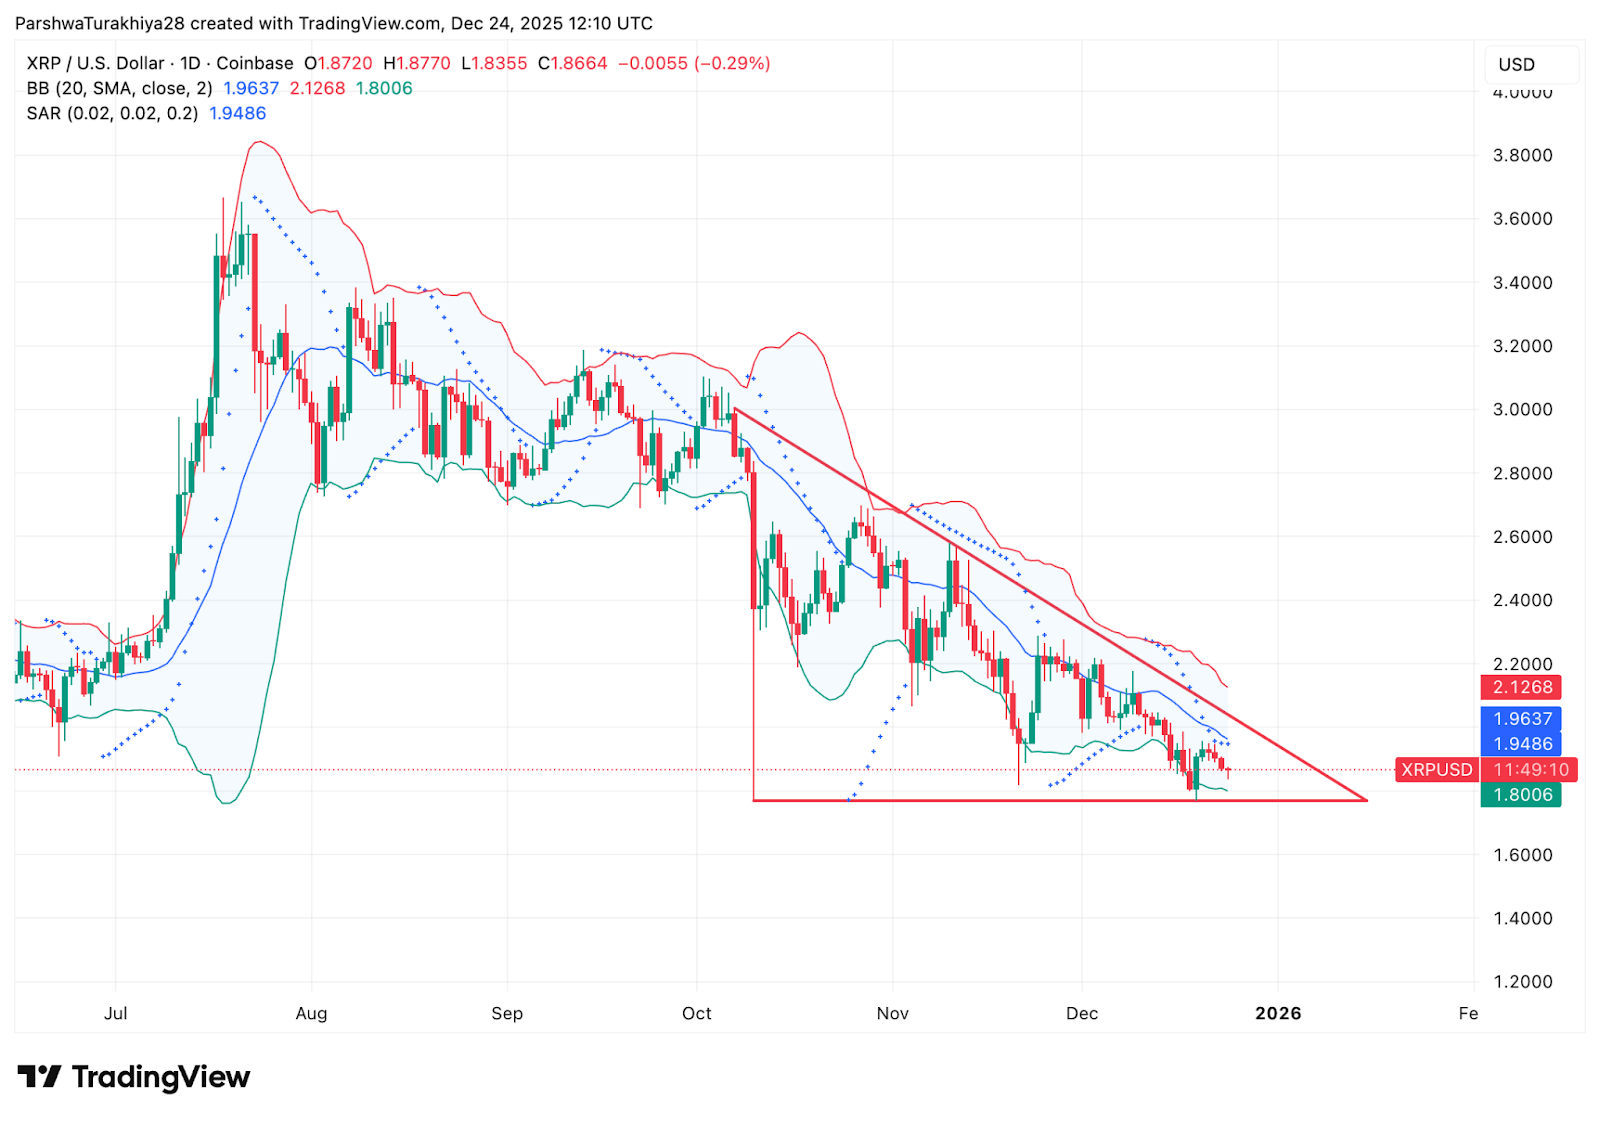
$XRP also trades below its mid-range Bollinger Band, with the upper band near $2.13 acting as dynamic resistance. The lower band sits near $1.80, which has become the key level buyers must defend. As long as price remains trapped between these bands, volatility stays compressed and directional conviction remains limited.
Parabolic SAR dots continue to track above price on the daily timeframe, confirming that trend control remains with sellers. The broader picture suggests consolidation within a downtrend rather than accumulation ahead of a breakout.
Short-Term Charts Show Relief Attempts, Not Reversals
$XRP Price Dynamics (Source: TradingView)
The 30-minute chart highlights short-term stabilization efforts but lacks confirmation of a trend shift. $XRP recently bounced from the $1.84 to $1.85 area and attempted to reclaim the descending intraday trendline. That move stalled quickly, signaling that sellers remain active on minor rallies.
Momentum indicators support that interpretation. RSI sits near the mid-50s, reflecting balance rather than strength. MACD has crossed modestly higher, but histogram expansion remains limited, suggesting the move lacks follow-through.
These signals point to short-covering and tactical buying rather than sustained demand. Without a decisive reclaim of the $1.95 region, short-term strength remains fragile.
Spot Outflows Continue To Cap Upside
$XRP Netflows (Source: Coinglass)
Flow data reinforces the technical picture. $XRP spot netflows remain negative, signaling ongoing distribution rather than accumulation. On December 24, netflows showed an additional $1.95 million in outflows, extending a pattern that has persisted for most of the quarter.
Sustained outflows suggest holders are using rebounds to reduce exposure rather than add risk. That behavior limits upside momentum and keeps price pinned near support despite periodic bounce attempts.
Until spot flows turn consistently positive, rallies are likely to face resistance rather than accelerate.
Long-Term Targets Stir Debate, Not Price Action
Beyond the charts, $XRP has drawn attention after South Korean scientist YoungHoon Kim outlined an extreme long-term scenario calling for a $1,000 price over the next decade. Kim framed the projection as conditional, citing assumptions around massive capital inflows into crypto, prolonged inflation, and a structurally weaker U.S. dollar.
The math behind that scenario is aggressive. With a circulating supply near 60.6 billion tokens, a $1,000 $XRP would imply a market value exceeding $60 trillion. Critics argue such a valuation would surpass major global assets, raising questions about feasibility.
Supporters counter that headline valuations overlook adoption, liquidity, and structural shifts in financial systems. Figures like Matthew Brienen and Armando Pantoja have echoed long-term bullish views, pointing to regulatory clarity and suppressed historical pricing as reasons $XRP could surprise over a multi-year horizon.
For now, those debates remain disconnected from short-term price behavior. Markets are focused on structure, flows, and liquidity, not decade-long projections.
Outlook. Will $XRP Go Up?
$XRP remains at a structural crossroads.
-
Bullish case: A decisive close above $2.00 breaks the descending trendline and signals renewed momentum toward $2.20 and higher.
-
Bearish case: A daily close below $1.80 confirms breakdown and exposes $1.65, with risk extending toward $1.50.
Until buyers reclaim trend resistance with improving flows, sellers retain control and patience remains the dominant strategy.
Disclaimer: The information presented in this article is for informational and educational purposes only. The article does not constitute financial advice or advice of any kind. Coin Edition is not responsible for any losses incurred as a result of the utilization of content, products, or services mentioned. Readers are advised to exercise caution before taking any action related to the company.

 coinedition.com