
- $WLFI drops again as long liquidations spike, yet support near $0.11 starts to regain attention.
- Treasury debate fuels pressure while clustered technical signals form near a likely support zone.
- Market fear rises, and $WLFI edges toward a band that halted two declines earlier in the year.
The $WLFI token extended its multi-week decline on Thursday, falling another 6% as a mix of market fear, leveraged liquidations, and governance uncertainty kept pressure on the token. The drop adds to a deeper weekly pullback of roughly 12%, continuing a downtrend that began after the September peak near $0.25. Still, a cluster of technical markers is beginning to gather near a familiar support zone, offering the first signs of potential stabilization.
Extended Selling Pressure as $WLFI Breaks Below Key Moving Averages
The token’s slide has kept it pinned below key short-term moving averages, reinforcing a trend that traders have struggled to counter. The 20-day sits near $0.1474, and the 50-day is slightly lower at $0.1434, both positioned above $WLFI’s latest print around $0.1281.
That arrangement tends to show momentum leaning decisively toward sellers. Derivatives data echoes the same direction. Long-side liquidations spiked to about $3.31 million over the past day, according to CoinGlass, while short liquidations barely moved, totaling only $6.69K.
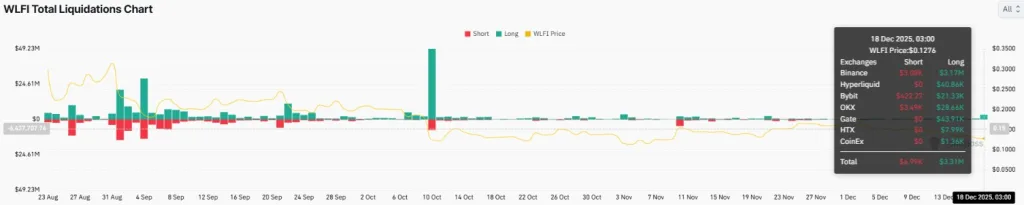
The imbalance suggests that long positions continue to get forced out during sharp moves, which usually leaves traders retreating into lower-risk stances and, in some cases, flipping into shorts simply to avoid further damage. Similarly, funding rates haven’t budged out of negative territory either.
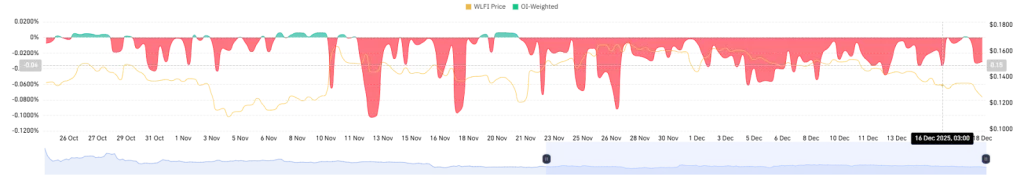
At press time, the weighted rate stands at -0.0310, a level that signals short sellers are paying to keep their positions open. That pattern has lingered since early November and has become one of the more persistent features of $WLFI’s recent bearish trading landscape.
Treasury Proposal Splits Community and Adds a Second Layer of Pressure
The $WLFI’s internal governance debate has only deepened the tension. The team proposed using 5% of its treasury to drive new adoption of $USD1, its dollar-pegged stablecoin. As per the report, the funds would support partnerships across centralized and decentralized markets and were pitched as a way to strengthen $USD1’s position.
But early reaction hasn’t leaned in the team’s favor. Roughly 53% of initial voters rejected the plan, citing concerns about treasury discipline and the strain that additional token unlocks could place on an ecosystem already managing 26.7 billion $WLFI in circulation.
Other holders questioned whether the team should prioritize $USD1 expansion when the stablecoin’s roughly $2.7 billion footprint still trails larger competitors such as PYUSD. However, the vote closes on December 19. Until then, traders appear reluctant to commit to major positions, leaving $WLFI more exposed to wider market swings.
Macro Environment Turns Risk-Off as Bitcoin Dominance Rises
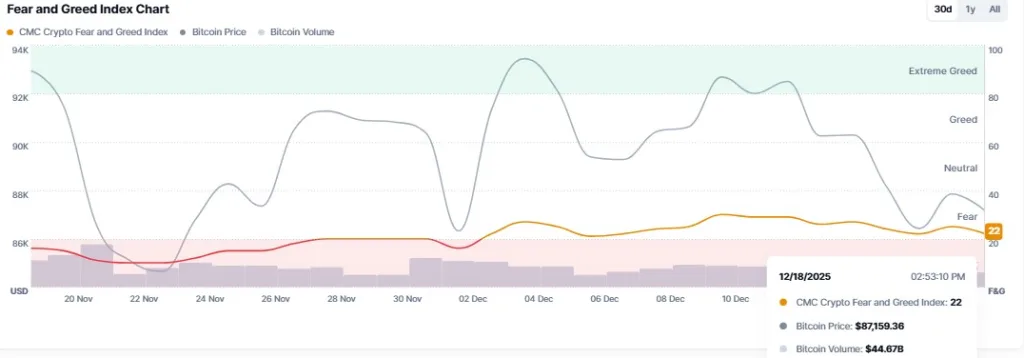
On the other hand, $WLFI’s struggles are unfolding in a broader environment marked by hesitation. The Fear & Greed Index stands at 22, reflecting “Extreme Fear,” while Bitcoin’s dominance now sits at 59.4%. Such sentiments hint that capital is rotated toward the market’s most liquid asset, often at the expense of smaller tokens.
The total crypto market slipped only 0.46% in the past 24 hours, but $WLFI’s sharper 6% drop placed it among the weaker performers. This type of environment typically amplifies the impact of internal disputes or a weak technical posture. With risk appetite fading, traders tend to avoid assets with unresolved governance narratives or inconsistent liquidity.
Related: XRP Price Stalls at $1.80 Key Support: Freefall Ahead or Fresh Bounce?
Technical Confluence Points to a Possible Bottom Near $0.11–$0.10
Even so, the chart is nearing a band that has stopped sell-offs before. The $0.11–$0.10 region has generated rebounds twice this year, and $WLFI is inching back toward it again. The zone lines up with the 23.60% Fibonacci level, which adds a bit of structure for traders looking for any sign of stabilization.
Market-profile data support the same range. $WLFI has now traveled from its Value Area High, through the Point of Control, and eyes the Value Area Low, positioned right inside that $0.11–$0.10 pocket, creating a stack of overlapping support signals.
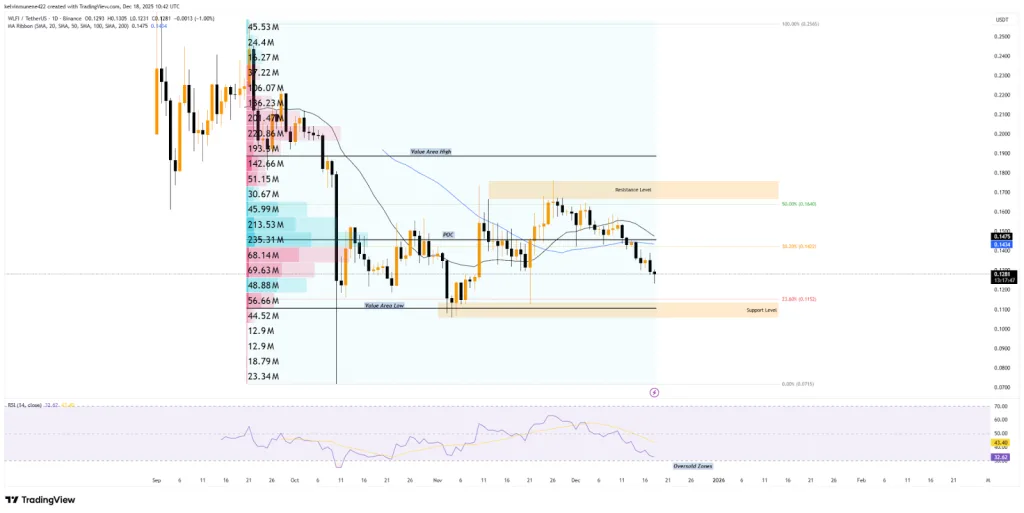
When multiple frameworks point to the same landing zone, traders tend to take note, even in a downtrend this steep. Besides, momentum readings are approaching their own limits. The RSI is parked around 32, near oversold territory. While not a guarantee of reversal, readings in this neighborhood frequently accompany slower downside follow-through.
For now, $WLFI remains under clear pressure. Yet for the first time in weeks, several unrelated indicators are pointing to the same zone. Traders watching for a potential bottom are likely to focus squarely on whether the $0.11–$0.10 level holds in the days ahead.
Disclaimer: The information provided by CryptoTale is for educational and informational purposes only and should not be considered financial advice. Always conduct your own research and consult with a professional before making any investment decisions. CryptoTale is not liable for any financial losses resulting from the use of the content.