
Key takeaways
- $ADA is down 4% in the last 24 hours and is now trading below $0.37.
- The bearish trend could see $ADA decline below the $0.30 psychological level.
Cardano’s on-chain shows further bearish movement
Cardano’s $ADA is down by 4% in the last 24 hours, making it one of the worst performers among the top 10 cryptocurrencies by market cap. The bearish performance comes amid poor on-chain data.
According to Santiment’s Social Dominance metric for Cardano, the current outlook for the cryptocurrency remains bearish. The index measures the share of $ADA-related discussions across the cryptocurrency media.
This metric has consistently declined since mid-November, reaching an annual low of 0.032% on Thursday. This dip indicates fading market interest and weakening sentiment among Cardano investors.
As more traders move their coins from wallets to exchanges, $ADA continues to face selling pressure as investors decrease their exposure to the market.
On the derivatives aspect, data also supports a further bearish outlook for $ADA. Coinglass’s OI-Weighted Funding Rate data show that the number of traders betting that the price of $ADA will decrease as more traders expect a price decline in the near term.
The OI-Weighted Funding Rate turned negative on Thursday, down 0.0019%, suggesting that shorts are paying longs. If this metric flips negative, $ADA usually faces heavy selling pressure.
$ADA could retest $0.30 as bears remain in control
The $ADA/USD 4-hour chart is bearish and inefficient as Cardano has underperformed over the past few days. The coin faced rejection from the upper trendline of the falling wedge pattern on December 9 and has lost 22% of its value since then.
At press time, $ADA is trading at $0.36 and could dip lower in the near term. If $ADA continues its downward trend, the bears could push the price towards the October 10 low of $0.27.
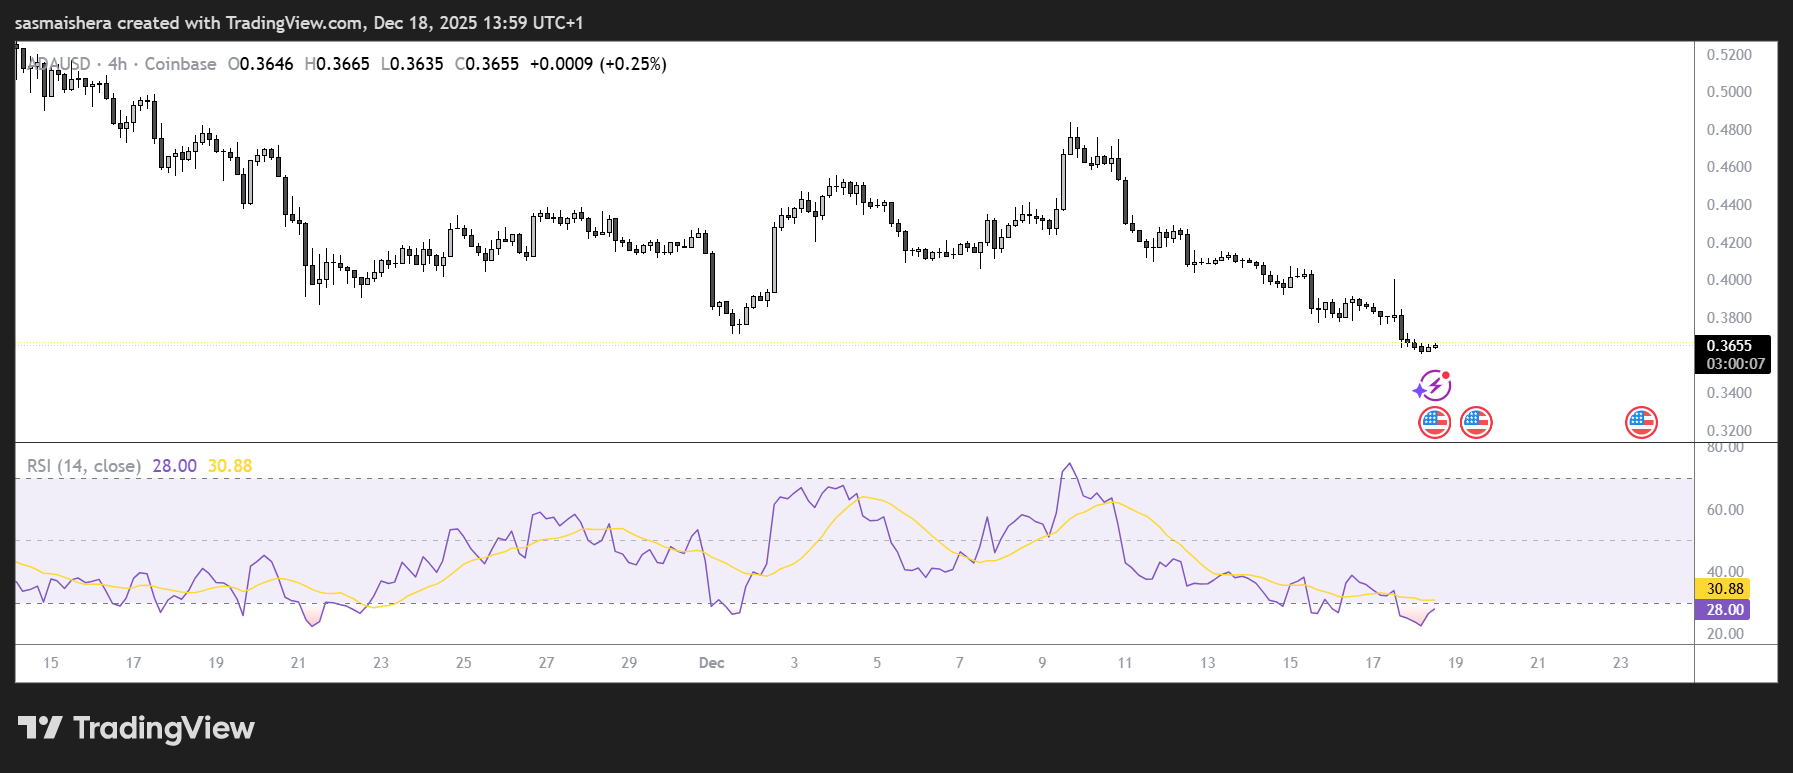 $ADA/USD 4H Chart">
The Relative Strength Index (RSI) on the 4-hour chart reads 31, nearing oversold territory, indicating strong bearish momentum. Furthermore, the Moving Average Convergence Divergence (MACD) indicator showed a bearish crossover on Monday, further supporting the negative outlook.
If the bulls regain momentum, $ADA could rally towards the 50-day EMA at $0.47 over the next few days.