@Sssebi
·Follow
8:50 pm · 13 Dec 2025
The Cardano market is navigating a decisive phase as price action compresses around a long-defended technical zone.
At press time, Cardano (ADA) was trading near $0.396, up about 2.7% over the past 24 hours.
But despite the short-term bounce, ADA price remains down roughly 14% on the week and close to 19% over the past month, reflecting persistent pressure across the broader crypto market.
Copy link to section
Cardano price has spent recent sessions probing the $0.37–$0.40 region, an area that has emerged as critical support on multiple timeframes.
This zone has repeatedly absorbed selling pressure following a sharp pullback from above $0.40, where profit-taking intensified amid a broader Bitcoin-led sell-off.
Earlier today, the market briefly lost the $0.38 handle before bouncing back and stabilising, keeping the focus firmly on whether buyers can continue to defend the lower boundary.
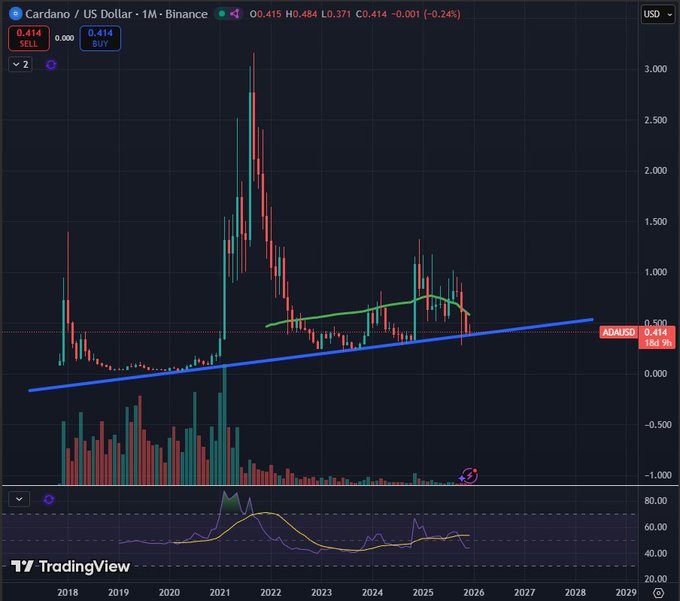
From a technical standpoint, ADA is sitting on a multi-year ascending trendline that has historically separated prolonged corrections from recovery phases.
Rather than breaking decisively lower, the price has compressed along this trendline, suggesting consolidation rather than capitulation.
Trading volume remains elevated near $500 million over 24 hours, but the balance between buyers and sellers still appears fragile, with technical momentum indicators reflecting this tension.
Oscillators such as RSI and Stochastic RSI remain bearish, while deeply negative readings on momentum measures hint at oversold conditions. Mostly, this combination often precedes short-term relief rallies, though it does not guarantee a trend change on its own.
Copy link to section
Several analysts argue that Cardano price forecast models are starting to lean constructive as downside momentum shows signs of exhaustion.
According to Ali Matinez, a TD Sequential buy signal has appeared on the daily chart, highlighting $0.37 as the key invalidation level.
As long as ADA holds above that threshold, the model allows for a recovery path toward the $0.50–$0.54 zone, which aligns with prior reaction highs.
Chart structure also supports this view since Cardano has been trading within a falling channel for several months, as highlighted by analyst Nehal, and recent price action suggests selling pressure is weakening near the lower boundary.
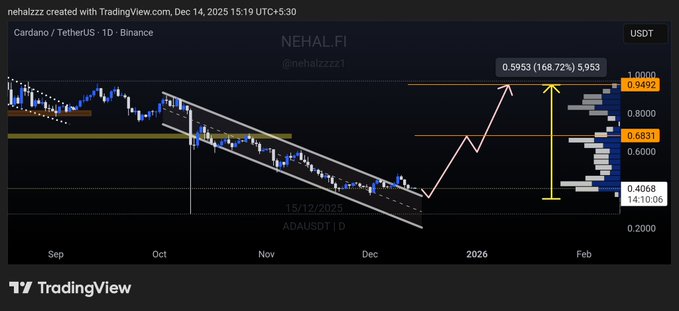
A confirmed breakout above the channel’s upper trendline would shift focus toward higher resistance between $0.60 and $0.68, levels defined by earlier consolidation and volume clusters.
Beyond near-term signals, longer-cycle analysis adds another layer.
TradingView analyst Migoreng_wrap frames the current decline as the latter stage of a corrective Wave 2 within a broader Elliott Wave Pattern.
In this view, the low near $0.37 completes the correction following the prior impulse that carried ADA to $1.32 in late 2024.
If the structure holds, a powerful Wave 3 could follow, with projections that ultimately challenge and exceed the previous all-time high.
Fundamentals are also part of the conversation with ongoing efforts to expand stablecoin liquidity and treasury-backed DeFi initiatives aiming to address long-standing constraints within the Cardano ecosystem.
At the same time, scaling solutions and privacy-focused infrastructure are designed to improve execution speed and institutional readiness, factors that could matter if market sentiment turns.