
XRP is extremely quickly nearing a point where a move of less than 5% could decide whether the price finally finds its floor or slips into a much uglier drop, with the Bollinger Bands laying out the risk on the TradingView chart.
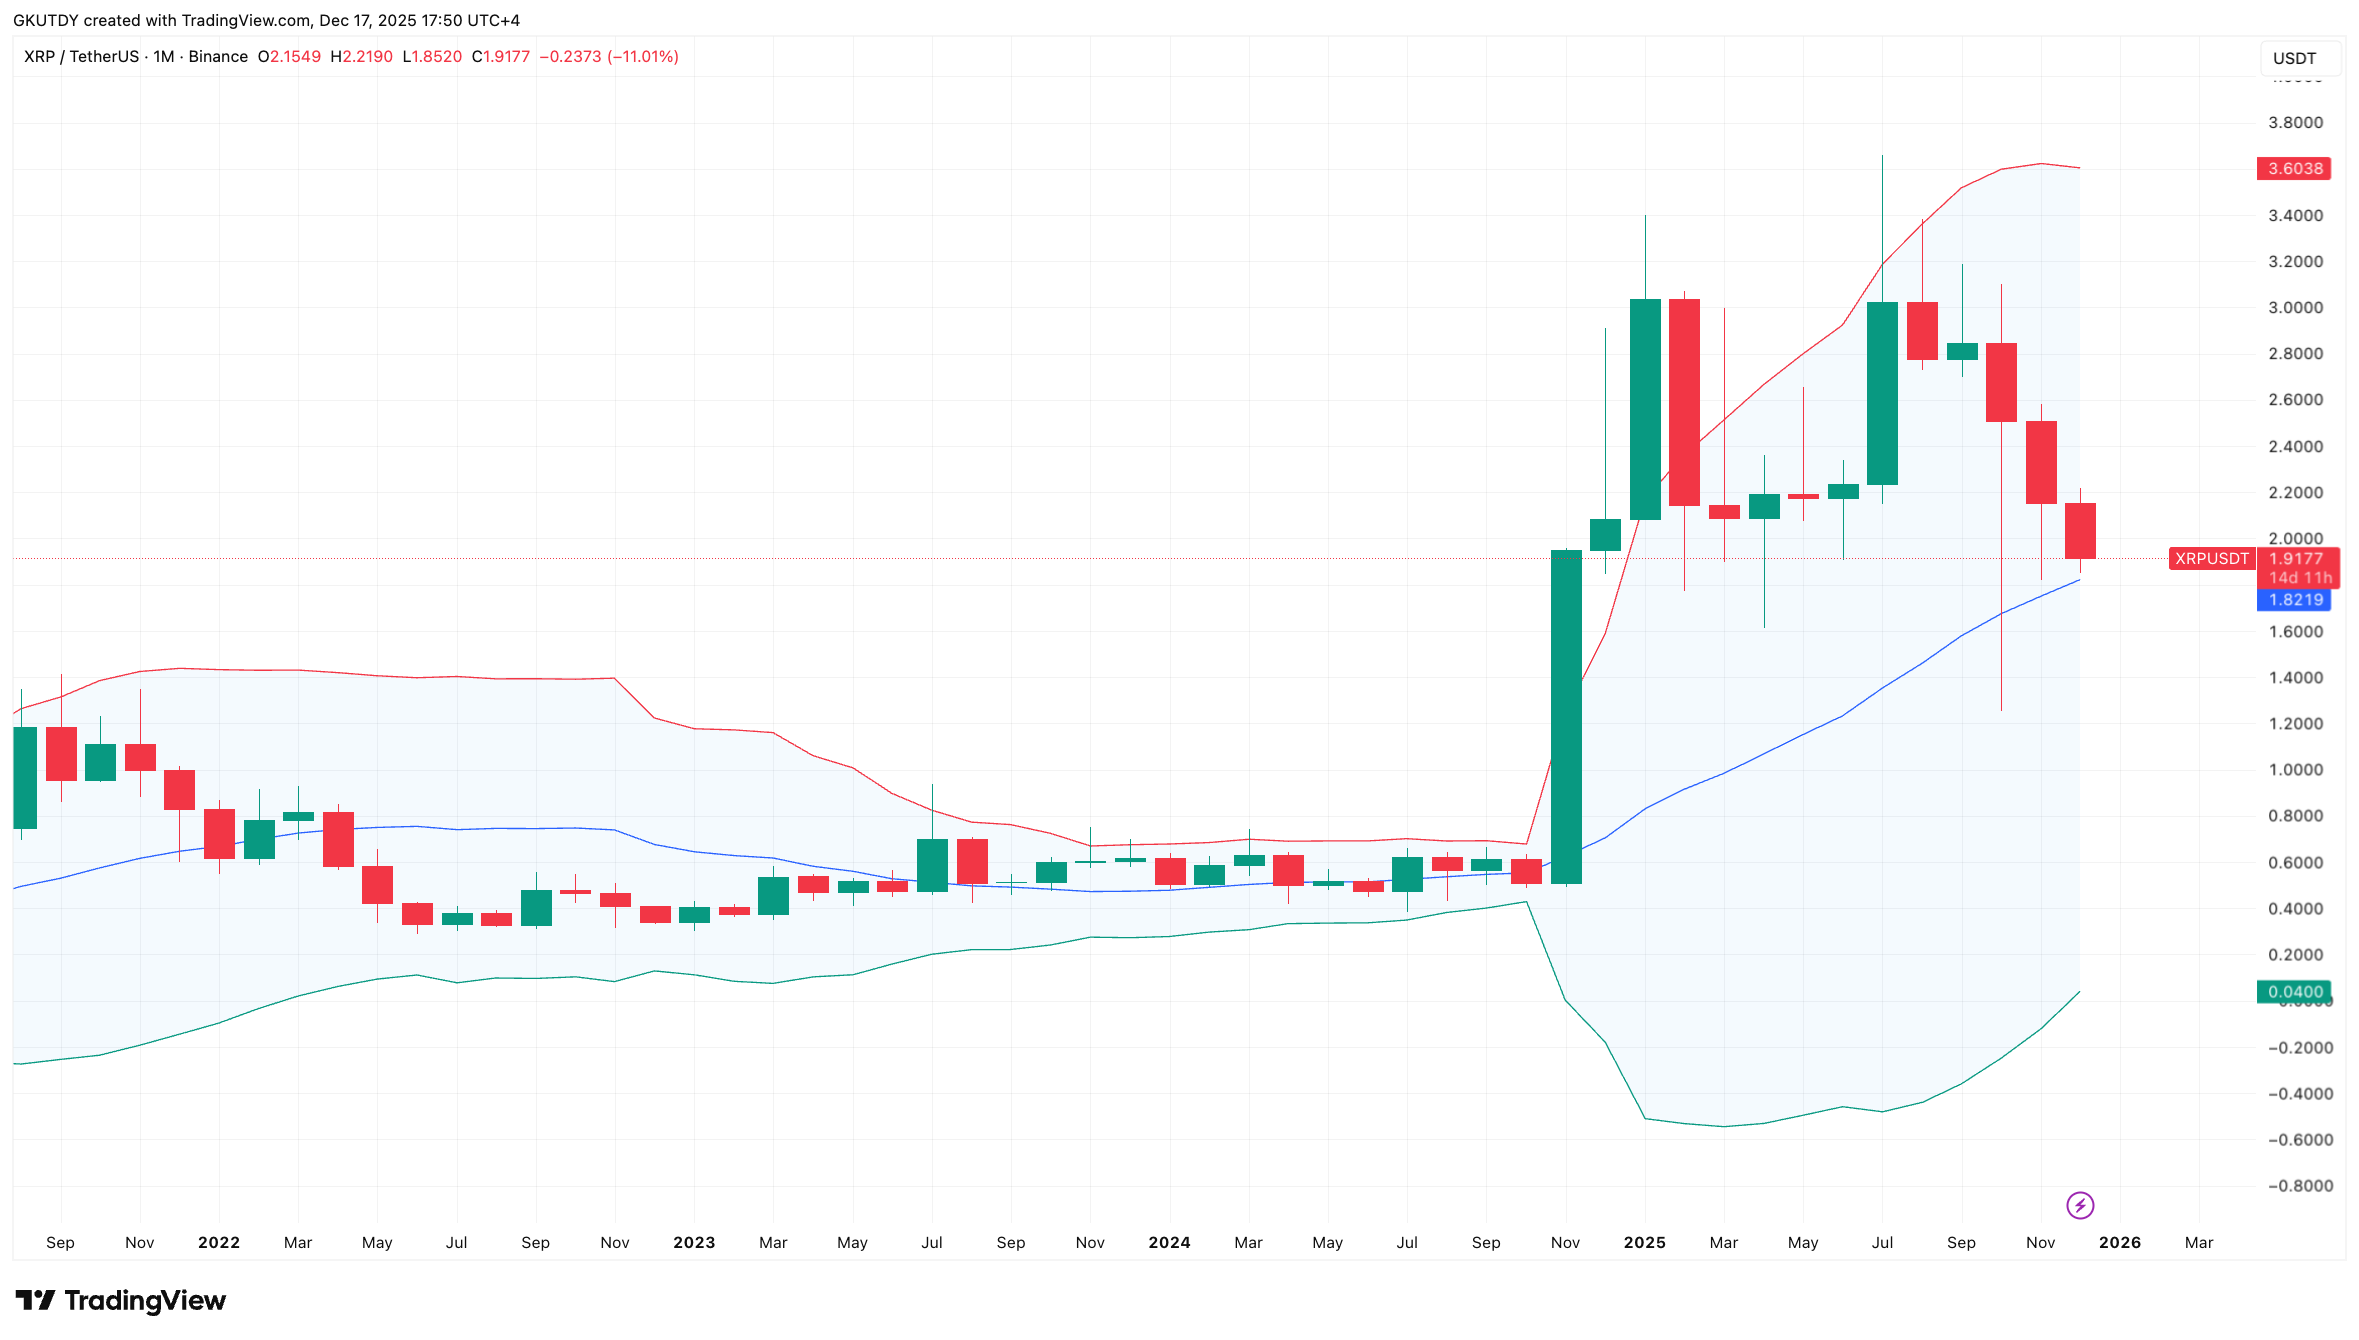
So, the XRP price is now almost perfectly parked right on the monthly Bollinger midband at $1.8214. This is not a casual level as on a monthly chart; it works like a yes-or-no line. Hold above it, and the sell-off looks like a normal pullback. Lose it, and the market will have no problem accepting lower prices fast.
Buyers are trying to hold this area, but what sits underneath is almost nonexistent. If XRP closes clearly below the midband, there is little nearby support to slow the move. Add here that the lower Bollinger Band is stretched all the way down near $0.0395, an extreme placement that shows how wide the downside will open if this level breaks.
That does not mean the price goes straight there, but it shows how little structure exists once the midband gives up.
Black Friday 2.0 for XRP
One price level stands out, however. The long downside wick from Oct. 10 around $1.2543 marks the last moment when buyers stepped in hard after selling picked up. If XRP loses $1.82, the far end of this wick becomes the next obvious area market participants will watch for for any real demand.
This puts XRP at a very clear fork in the road. Holding the midband keeps the recent drop looking like distribution after earlier gains. Losing it changes the picture and raises the odds of a disastrous price collapse.