
The cryptocurrency market has begun the new week bearish, but some coins are going against the trend and trading in the green.
While Bitcoin is trading below $90k, some cryptocurrencies, including $AAVE, have added gains in the last 24 hours.
At press time, $AAVE is trading at $194 per coin, up by less than 1% but could rally higher over the next few hours or days.
The native coin of the Aave ecosystem is approaching the upper boundary of its descending parallel channel, with a breakout expected in the near term.
Furthermore, on-chain and derivatives data also support bullish sentiment, with technical indicators suggesting a breakout towards $235 over the next few hours or days.
Aave’s on-chain and derivatives data show a strong bullish sentiment
Copy link to section
According to CryptoQuant, Aave’s spot and futures markets are showing large whale orders, cooling bearish conditions, and buy dominance.
These data support the bullish outlook for the cryptocurrency and could signal a potential rally in the coming days.
Looking at the derivatives data, CoinGlass shows that Aave’s funding rate data also support signs of a rally.
The Aave OI-Weighted Funding Rate data, the number of traders betting that the price of Aave will slide further is lower than those anticipating a price increase.
THE OI-Weighted Funding Rate flipped to a positive rate last week and currently stands at 0.0088%, suggesting that longs are currently paying shorts. Usually, when the rates flip from negative to positive, Aave’s price has rallied.
Furthermore, the $AAVE long-to-short ratio stands at 1.01, close to a new monthly high.
If the ratio is above one, it suggests that the bullish sentiment in the market outweighs the bearish sentiment.
Thus, more traders are betting on the asset price to rally.
Aave eyes a breakout, with major resistance around $235
Copy link to section
The $AAVE/USD 4-hour chart is bearish and inefficient as $AAVE has been unable to close the inefficiency gap left around $269.
The cryptocurrency is currently trading within a descending parallel channel pattern, as it is now approaching the upper boundary of this channel.
A breakout above this resistance channel could signal a potential bullish shift.
The momentum indicators suggest that buyers are in control of the market.
Relative Strength Index (RSI) on the 4-hour chart reads 50, indicating a growing bullish momentum.
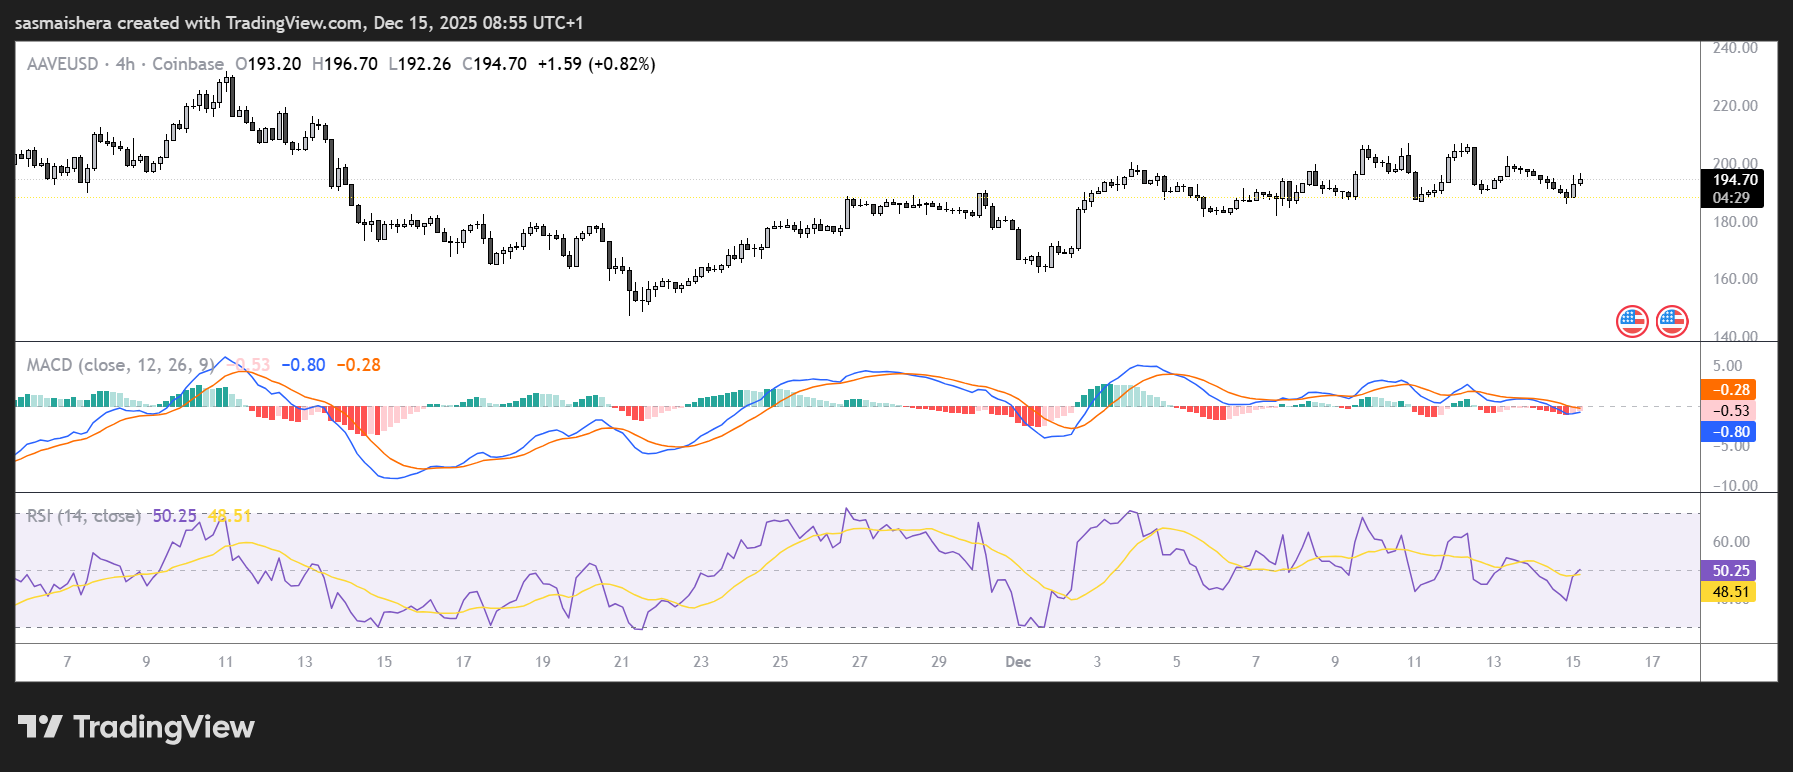
The Moving Average Convergence Divergence (MACD) showed a bullish crossover last week, which remains intact, further supporting the bullish thesis.
If the bullish trend continues, $AAVE could rally past the first major resistance level at $235 over the next few hours.
An extended rally would allow it to gain efficiency and hit the $296 resistance region in the medium term.
However, if $AAVE faces rejection around the $235 resistance, it could extend the decline toward the daily support level at $186.