Cardano is exhibiting a precise macro trend within a wedge, with a recent analysis showing a close correlation with its 2020 impulsive rally.
Amid the recent broader crypto market correction, analyst Quantum Ascend has shared an interesting Cardano price analysis. In his recent X post, he identified the coin’s macro trend within a channel and what could develop next as it reaches a crucial point.
Cardano Bottoms at Multi-Year Support
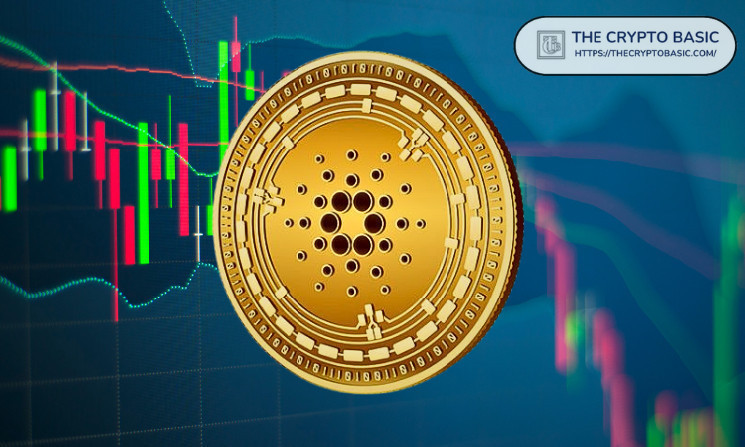
Notably, the analysis identified that Cardano trades close to the lower support trendline in a converging channel. For context, Cardano has trended within this channel since its market debut, making wave-like movements between the top and lower trendlines.
Data from the chart indicates that an area marked (A) coincided with the channel’s top and its January 2018 peak of $1.317. The point marked (B) is the bear season bottom at $0.018 in March 2020, while (C) represents the 2021 peak and current all-time high of $3.10.
Notably, $ADA is currently in the corrective (D) phase, and prices have held above the support trendline in this area. Quantum Ascend now expects another wave of bullish price action to begin, pushing the asset to the (E) point.
How High Can $ADA Go?
The analyst went further, explaining how high Cardano could go if it bounces. Importantly, he did this using the Fibonacci extension from previous drawdowns.
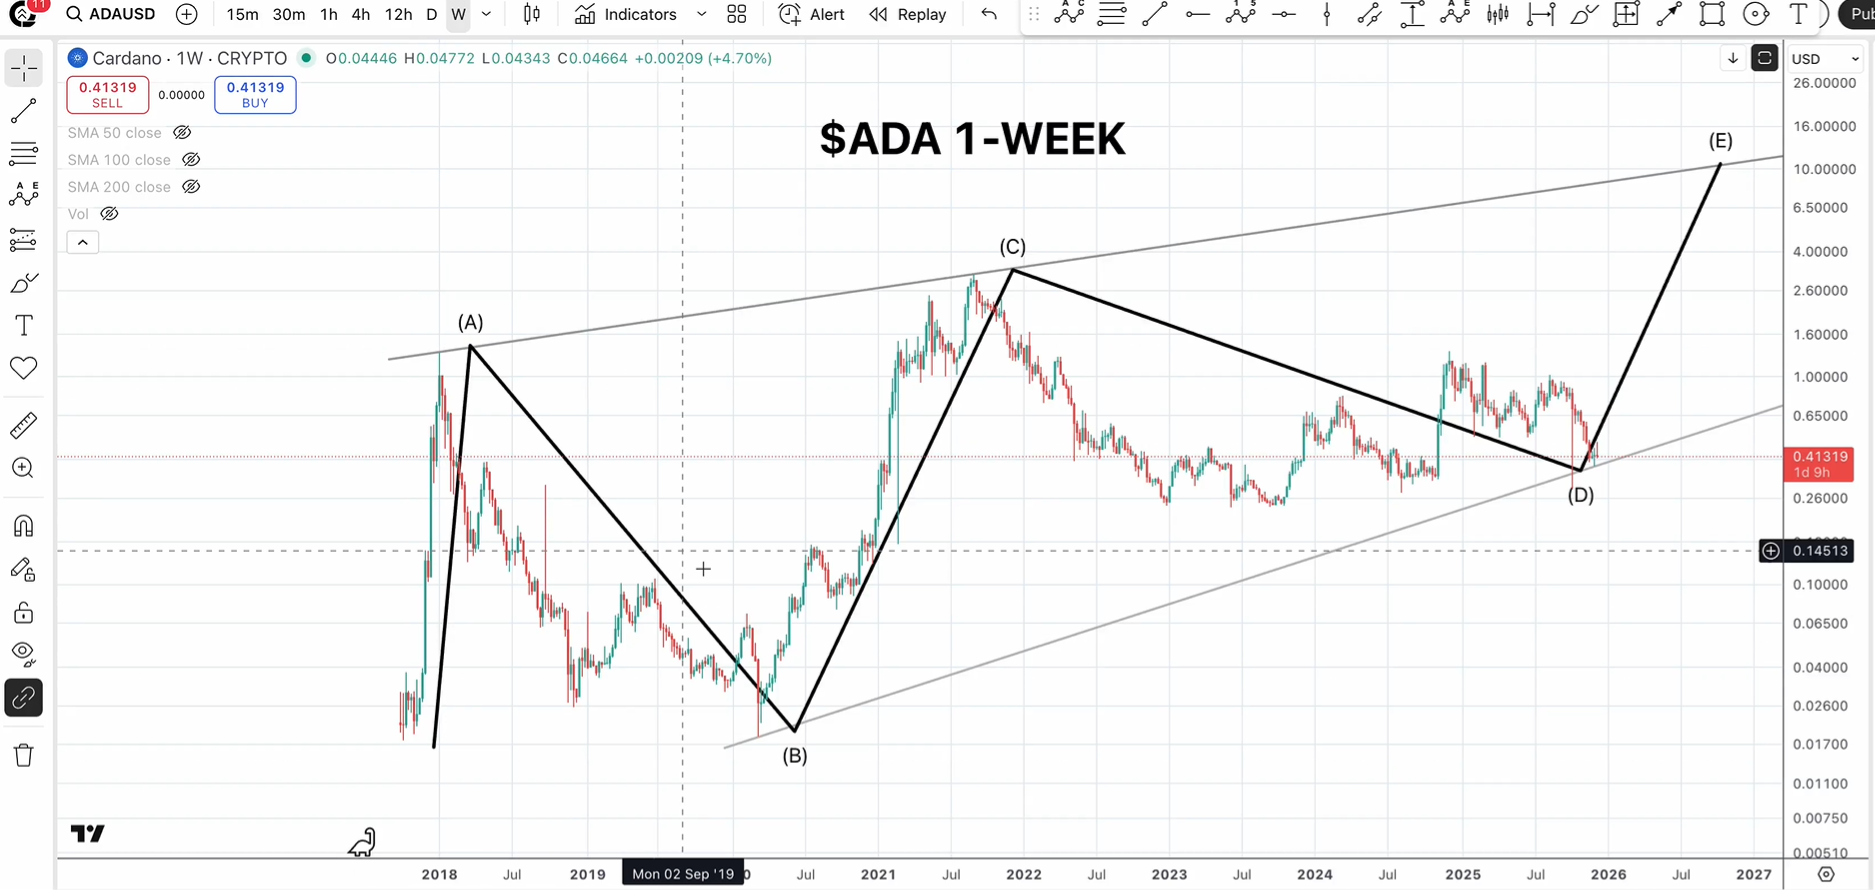
For instance, he calculated the upside target of the (A) to (B) drawdown, which coincided with the 4.23 Fibonacci level at $5.56. For further context, this target represents the highest possible price point from a retracement from a price top to a bottom.
He did the same for the (C) to (D) drawdown, and the 4.23 Fib. level stands at $12.40. Furthermore, he calculated the drawdown from the Trump-inspired run to December 2024’s high of $1.32 to its current level, and the 4.23 Fibonacci level was around $4.46.
With this, he set his conservative target for the wave (E) rally at $4.88 to $5.50. Meanwhile, his primary target is a 2,500% rise to a new all-time high of $10.4.
Meanwhile, regarding the feasibility of this target, Quantum Ascend believes that the $10 price range is realistic. He highlighted that $ADA rallied by 16,773% from point (B) to (C) between 2020 and 2021.
$ADA also posted a 7,431% gain from its 2018 lows to the channel’s top at (A) in 2018. As a result, a 2,500% rise to $10.4 from the current support level is not a “crazy” target.
Cardano Shows a Similar Fractal to 2020
The analyst also claimed that Cardano’s price development is similar to its 2020 performance, which preceded its 2021 peak price. During the correctional phase from (A) to (B), Cardano pulled back from $0.107 to the bear market low of $0.018 but first touched the 0.50 Fibonacci level of $0.091 before reaching the low.
This similar pattern is playing out again as Cardano pumped to August’s high of $1.02, aligning with the same 0.50 Fibonacci level as the 2020 correctional pattern. Citing this, he predicted that $ADA would mirror the 2020 uptick.