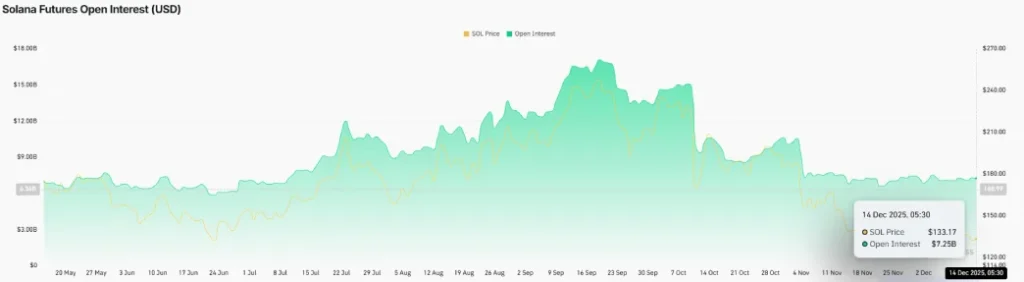
Amid Solana’s ongoing price consolidation, futures market activity is still notably subdued. Open interest in Solana futures has remained around $7.3 billion since mid-November, with hardly any directional movement. This flat OI profile signals a lack of fresh capital flowing into leveraged positions and indicates a cautious speculative appetite, with traders hesitant to trade in the absence of a clear market driver.
While stable open interest is a good sign that the market is not subject to excessive leverage or forced liquidations, the failure to expand significantly is often indicative of indecision.
Such circumstances are usually conducive to prolonged sideways price action, where participants await a clear catalyst, such as new ETF-related inflows, protocol upgrades, or a change in market sentiment, to establish a stronger trend.
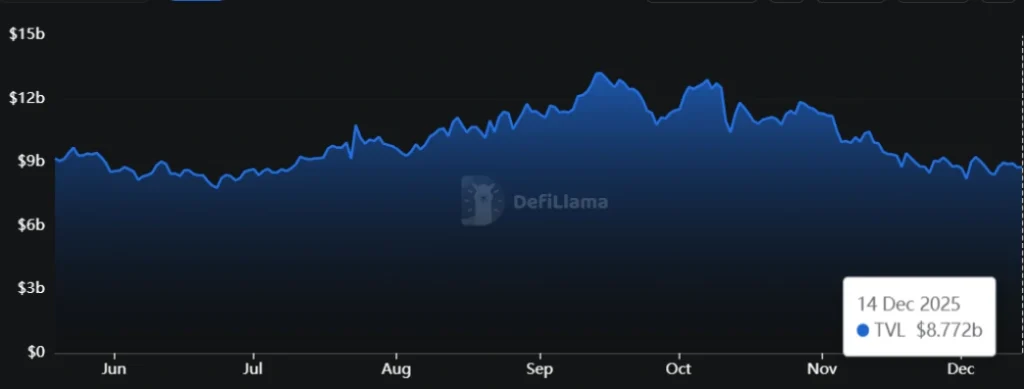
On-chain metrics reinforce this subdued backdrop. Solana’s total value locked across DeFi protocols has been a similarly flat line. Data from DefiLlama indicates that TVL is holding close to $8.77 billion, with a negligible increase of 0.04% in the past 24 hours.
While the flatline trend may suggest sustainability and no major outflows from investors, the absence of meaningful fluctuation since mid-November hints at low new capital deployment into the ecosystem.
If the aforementioned metric continues for a prolonged period, the Solana price would struggle to drive a sustained recovery.
Solana Price Awaits Major Breakout From Range Pattern
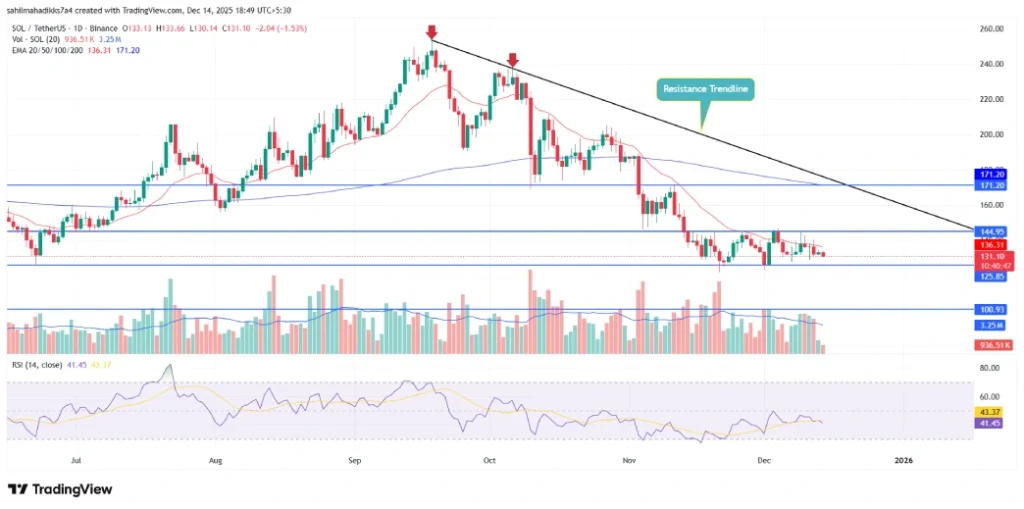
The prevailing correction trend in Solana price has recently stabilized above the $125 support. The current price trajectory continues to consolidate between the aforementioned psychological support and $145 resistance.
The coin price has bounced several times within the range, accentuating the lack of initiation from buyers or sellers to drive a sustained recovery. However, the coiling would allow any party to recoup their grip over this asset and give a respective breakout.
The Solana price is currently trading below the key exponential moving averages (20, 50, 100, and 200), indicating the path of least resistance is downward. If the coin price breaks the $125 support, the selling pressure would accelerate and drive an extended correction of another 20% to hit $1,000 lower.
$SOL/USDT -1d Chart
On the contrary, if the coin price manages to break $1.45 resistance, the coin price could jump roughly 10% before challenging a key resistance trend and adding the $160 mark.

 cryptonewsz.com