
Following days of extended capital outflows, $XRP’s technical structure is signaling more trouble, with the asset facing the possibility of plunging toward the $1 level.
The token is currently hovering above the $2 mark, a price area that has repeatedly acted as a structural floor in recent months.
Now, fresh insights suggest this support is under sustained pressure, putting downside targets firmly back into focus, according to an outlook shared by Ali Martinez in an X post on December 13.
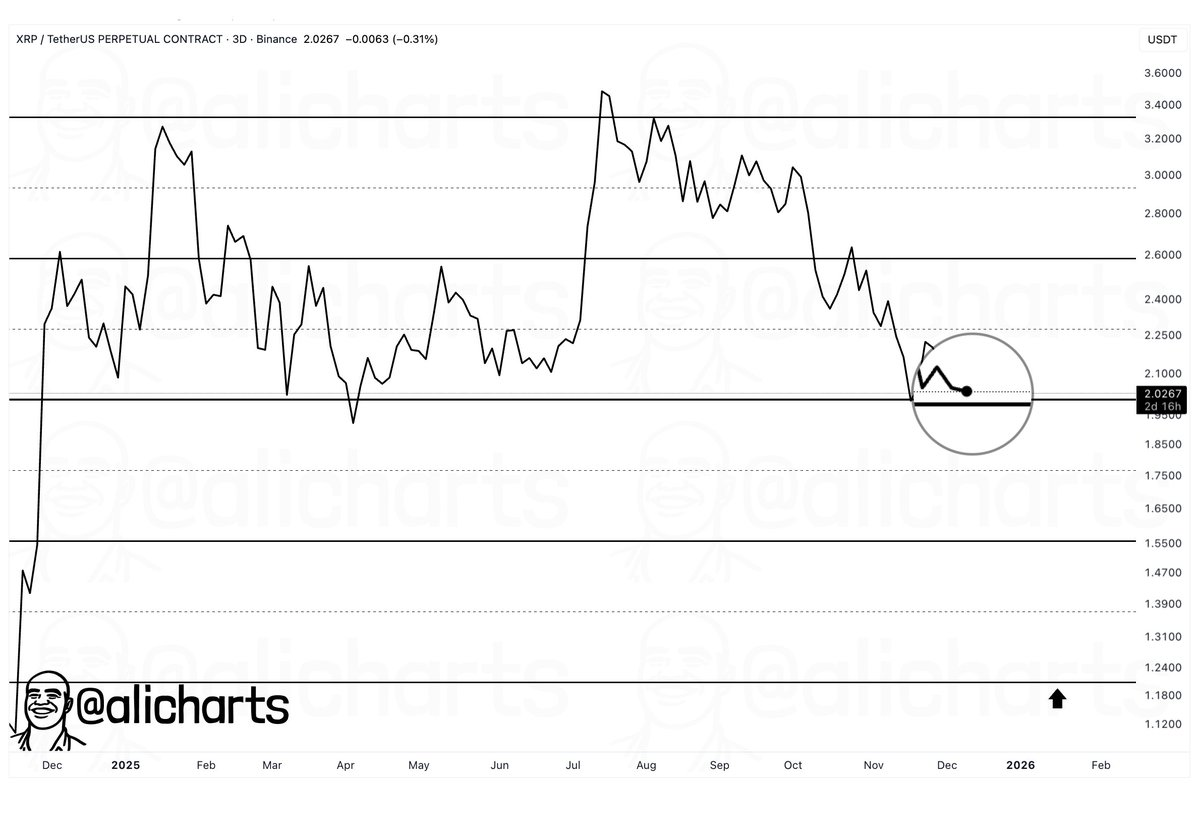
According to his analysis, on the higher time frame, $XRP has shifted from strong upside expansion into a clear downtrend defined by lower highs and lower lows.
$XRP key price levels
After topping above $3.40 earlier in the year, momentum faded, with the price breaking below key supports at $2.60 and $2.25. Each subsequent rebound has weakened, pointing to declining bullish conviction and a firmly bearish market structure.
The key development is $XRP’s consolidation just above $2, marked by tightening price action and lower volatility. While this signals indecision, following an extended decline, it more often points to downside continuation rather than recovery.
Technically, $2 is a key psychological and structural support for $XRP. A decisive break below it would confirm the loss of long-term support and open the way for a drop toward $1.20, a level aligned with past consolidation and historical reactions. Once $2 fails, selling pressure could accelerate as stop-losses are triggered.
Notably, in recent sessions, $XRP has been weighed down by broader cryptocurrency market sentiment, which has seen the asset briefly dip below $2 alongside reported outflows of about $6 billion.
Still, there are hints of a possible rebound, as ETF inflows remain strong and investors appear to be moving tokens off exchanges, a signal that can precede price stabilization or recovery.
$XRP price analysis
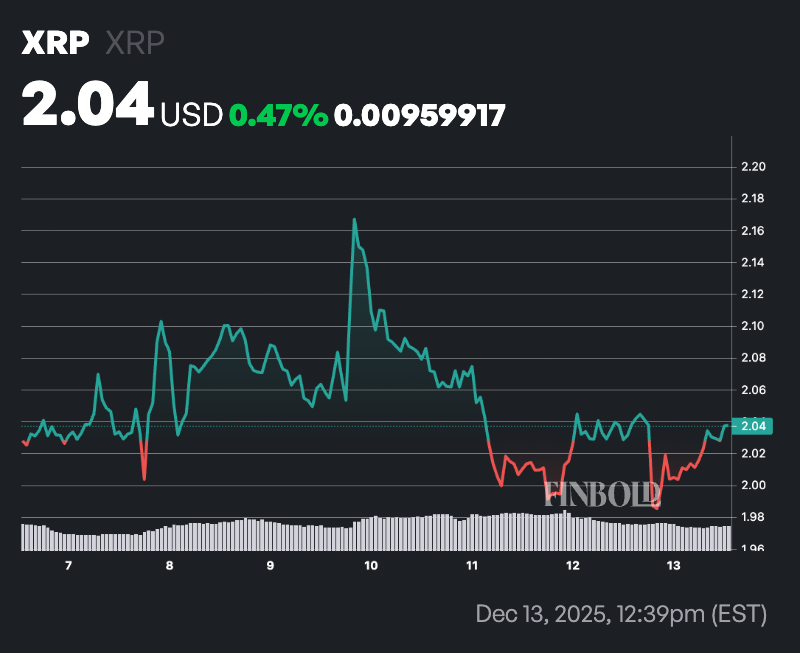
By press time, $XRP was trading at $2.04, up about 0.5% over the past 24 hours. On the weekly chart, the asset has posted a similar gain.
Meanwhile, $XRP’s troubles are further reflected in its technical positioning, as the token remains below both its 50-day simple moving average (SMA) of $2.27 and its 200-day SMA of $2.60.
This setup signals a persistent downtrend across both short- and long-term horizons, with the wider gap to the 200-day average pointing to deeper bearish momentum.
Complementing this, the 14-day Relative Strength Index (RSI) at 41.51 sits in neutral territory but leans toward mild oversold conditions, suggesting selling pressure is easing, though not yet at levels that typically trigger a strong rebound.
Featured image via Shutterstock