
Solana ($SOL) is down 4.5% in the last 24 hours, making it one of the worst performers among the top 10 cryptocurrencies by market cap.
The coin is now trading at $130 per coin after being rejected at the upper boundary of its falling wedge pattern.
The broader cryptocurrency is showing signs of weakness following the Federal Reserve’s hawkish rate cut on Wednesday.
Furthermore, $SOL’s on-chain data suggests that the coin could record further downward movement, with rising sell-side dominance.
$SOL dip amid Fed’s cautious rate cut
Copy link to section
The broader cryptocurrency market has underperformed over the last 24 hours after the Federal Open Market Committee (FOMC) meeting on Wednesday.
As expected, the US Federal Reserve (Fed) lowered interest rates by 25 basis points to 3.50%-3.75% at the end of the FOMC meeting.
However, the apex bank signaled a likely pause in January.
Alexis Sirkia, Chairman of Yellow Network, told Invezz in an email that the market is mulling over the Fed’s decision of a third-quarter-point rate cut to ease the affordability crunch.
The irony here is that the Fed itself is operating with limited visibility due to the government shutdown, itself looking to make a critical decision on incomplete data.
The policymakers projected that there would likely be one rate cut in 2026.
This was the same outlook as in September, which tempered market expectations and contributed to short-term pressure on risk assets.
The hawkish rate cut triggered a slight risk-off sentiment, with major cryptocurrencies such as Bitcoin, Ether, XRP, Solana, and Cardano all recording losses over the past few hours.
In addition to the Fed’s policy, data obtained from CryptoQuant shows that Solana is currently experiencing selling pressure. The Taker CVD (Cumulative Volume Delta) for $SOL turned negative on Wednesday, suggesting that sellers are in control.
This indicator calculates the cumulative difference between market buy and sell volumes over three months.
With the indicator currently negative and decreasing, it indicates that $SOL is in the Taker Sell Dominant Phase.
Furthermore, CryptoQuant’s Futures Average Order Size indicator reveals a surge in smaller order sizes, indicating an increase in retail activity in the market.
However, the smaller order size shows that the retail traders are not confident about $SOL’s price in the near term.
$SOL could retest $120 after facing rejection from a key level
Copy link to section
The $SOL/USD 4-hour chart remains bullish and efficient despite Solana losing 4.5% of its value in the last 24 hours.
The coin’s price faced rejection from the $142 trendline boundary on Wednesday, failing to overcome the $145 resistance level.
At press time, $SOL is trading at $130.87 and could face further selling pressure if the bearish momentum persists.
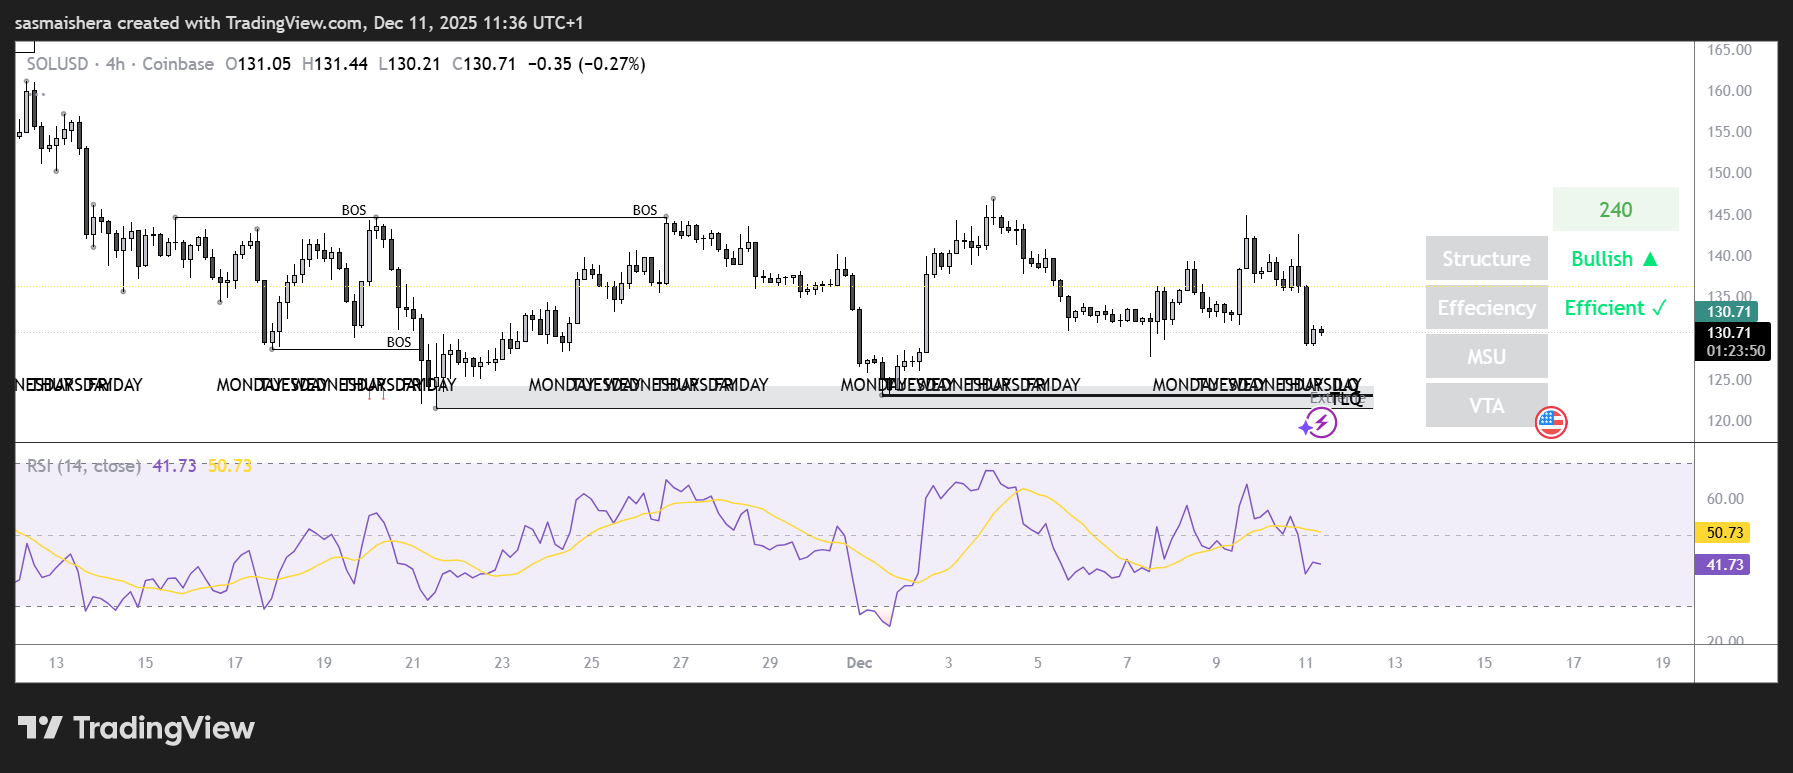
If the downward trend continues, $SOL could extend its decline towards the November 21 low of $121.66.
The RSI of 42 is below the neutral 50, indicating bearish momentum.
The MACD lines are also within the negative region as sellers remain in control.
However, if $SOL recovers and buyers regain control, $SOL could rally towards the next major resistance level at $151.60.