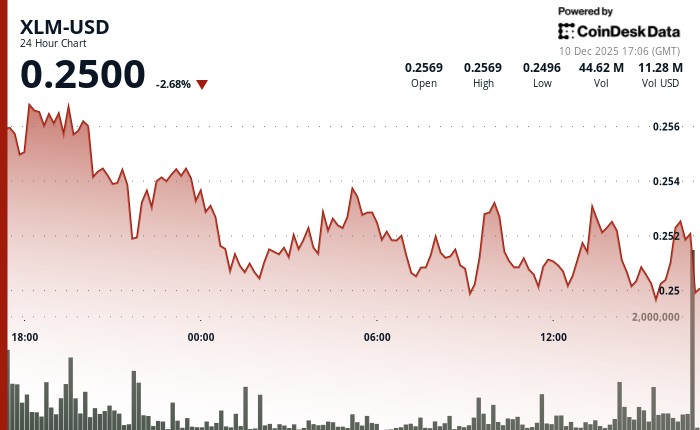
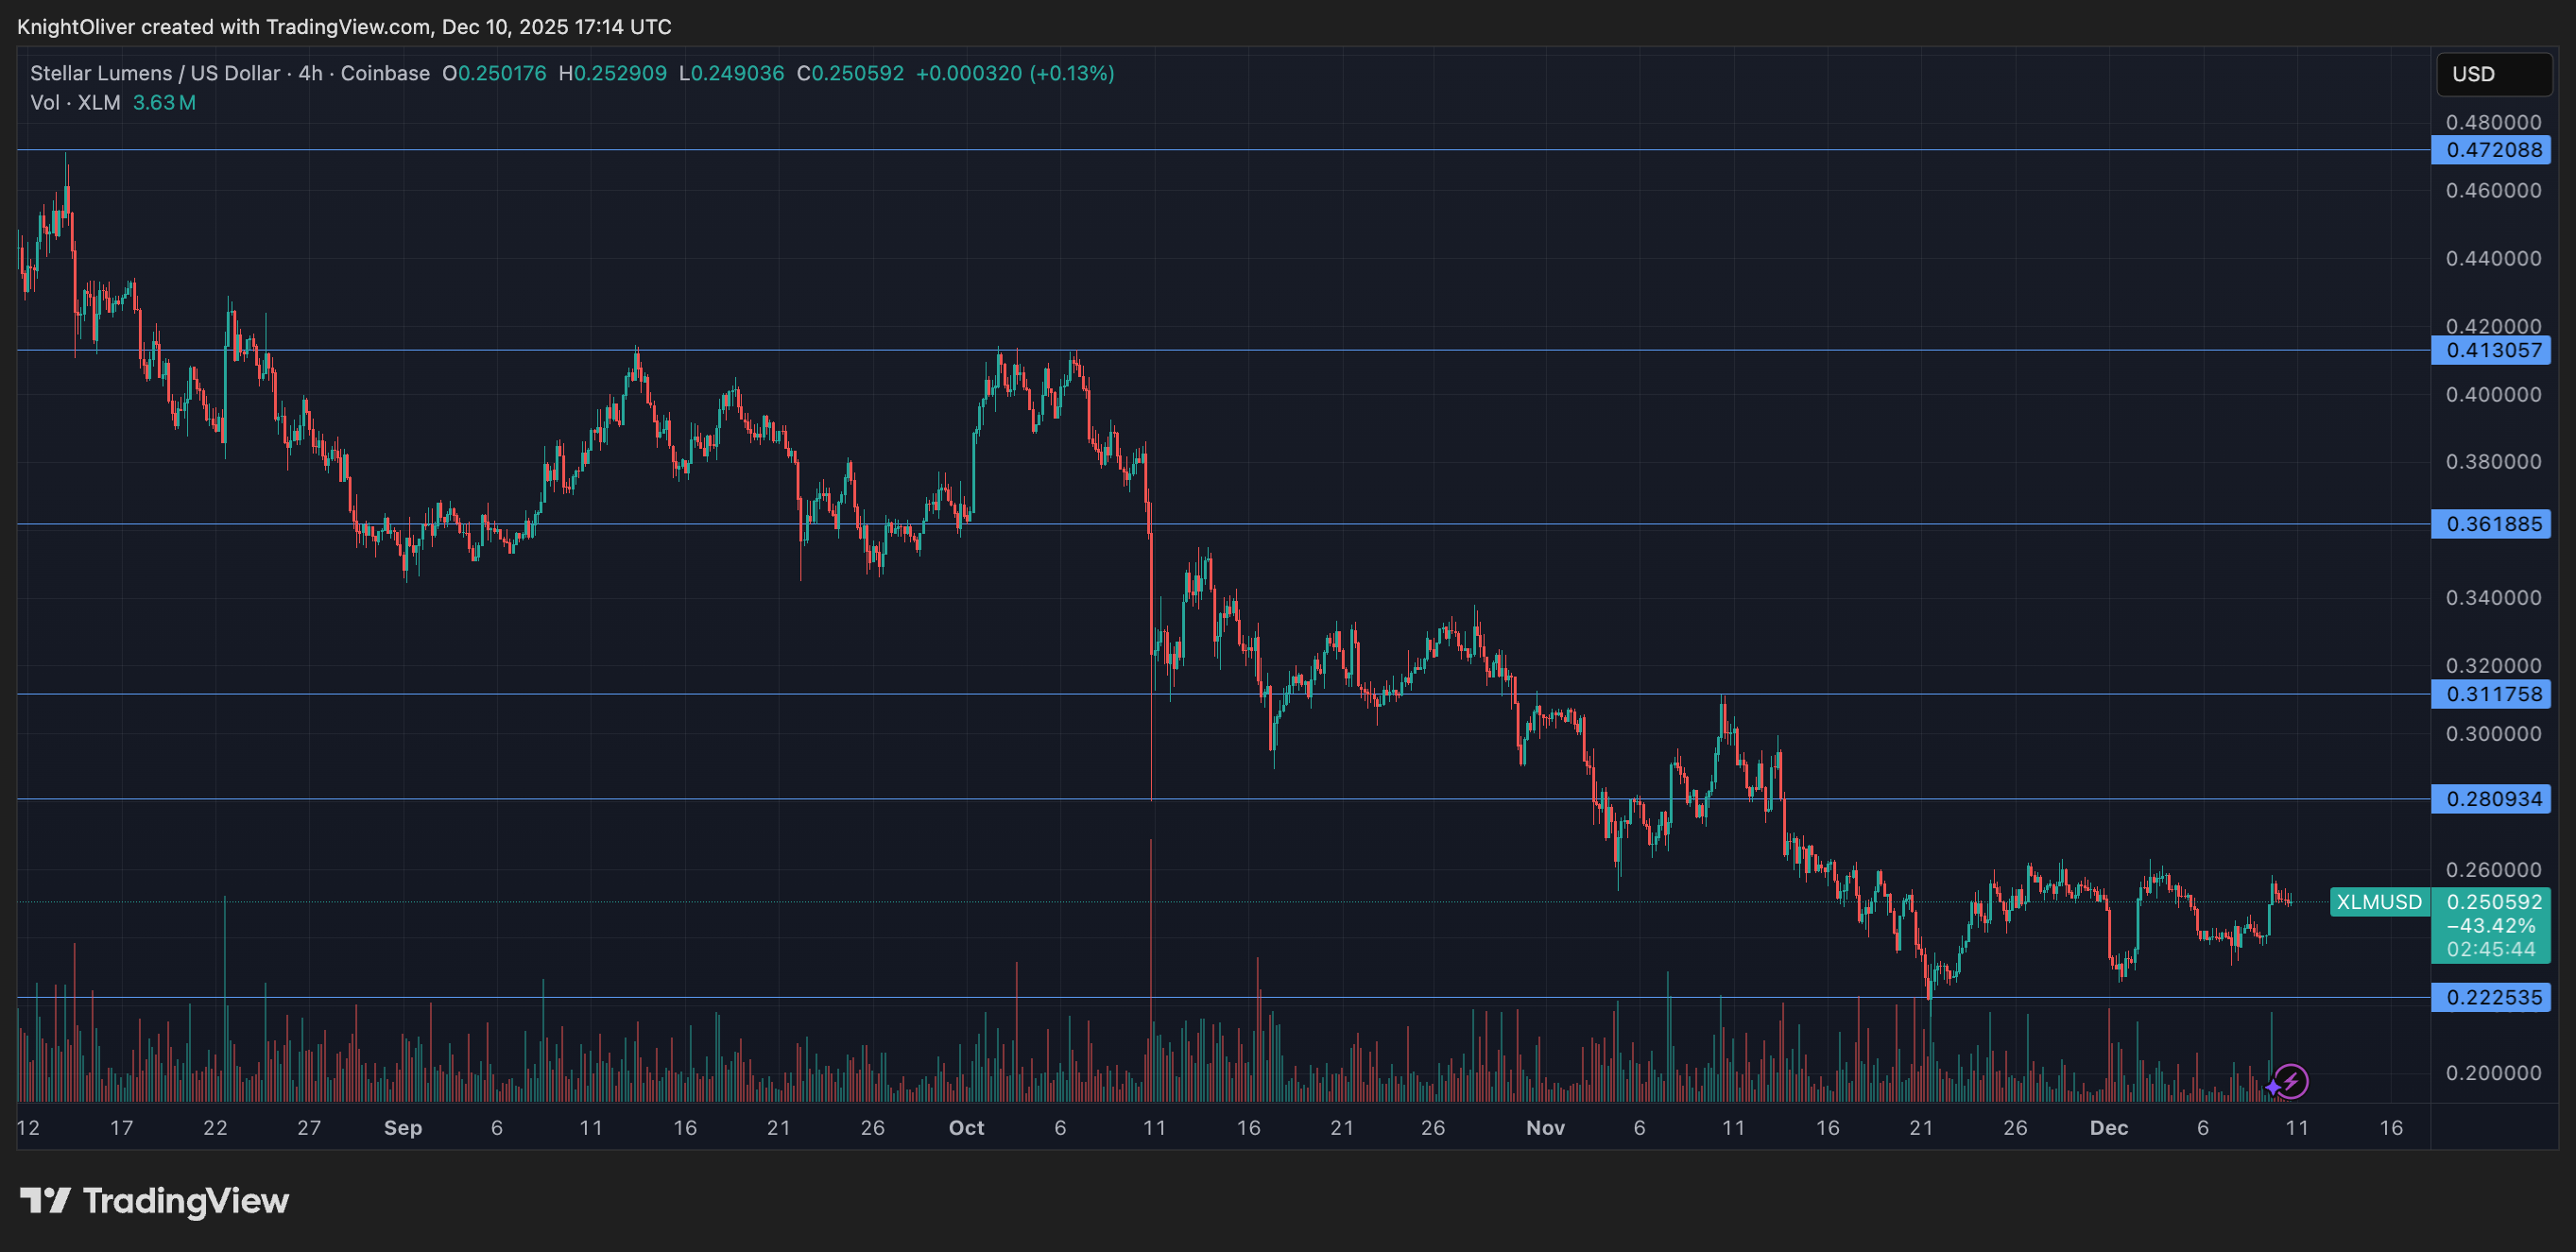
In the absence of clear fundamental catalysts, technical levels around $0.25 became critical as institutional flows shaped price discovery. Elevated volume without corresponding momentum suggests a standoff between buyers and sellers around current levels.
This pattern typically precedes either consolidation breakouts or gradual accumulation phases. The outcome depends on whether institutional interest can overcome existing selling pressure at current levels.
Key technical levels signal consolidation phase for $XLM
Support/Resistance: Critical support holds at $0.2500 following multiple successful tests; resistance forms at $0.2578 after initial surge failure.
Volume Analysis: Peak institutional activity hits $0.2578 with 245% surge above 24-hour averages; volume exhaustion marks session end.
Chart Patterns: Volatile sideways consolidation spans $0.0081 range (3.2%); systematic decline through lower highs pattern.
Targets & Risk/Reward: Breakdown below $0.2500 triggers additional selling pressure; sustained hold above maintains bullish structure for breakout potential.
Disclaimer: Parts of this article were generated with the assistance from AI tools and reviewed by our editorial team to ensure accuracy and adherence to our standards. For more information, see CoinDesk's full AI Policy.

 coindesk.com