SOL coin price shows active buying at $80 level, pausing the high-momentum downtrend and indicating a possible trendline breakout.
Key technical points:
- The 100 and 200-day EMA shows a bearish crossover
- The RSI slope shows a significant bullish divergence within SOL price action
- The 24-hour trading volume in the Solana token is $2.03 Billion, indicating a 26% rise.
Past Performance of SOL
The sellers at $250 have driven the downtrend below the psychological cushion of $100 and take support at $80. The previous shoot-up from $80 surpassed the $100, but the death cross resulted in a bullish failure, driving the price back. However, the recent support marks the breakout possibility of the downtrend-produced trendline. 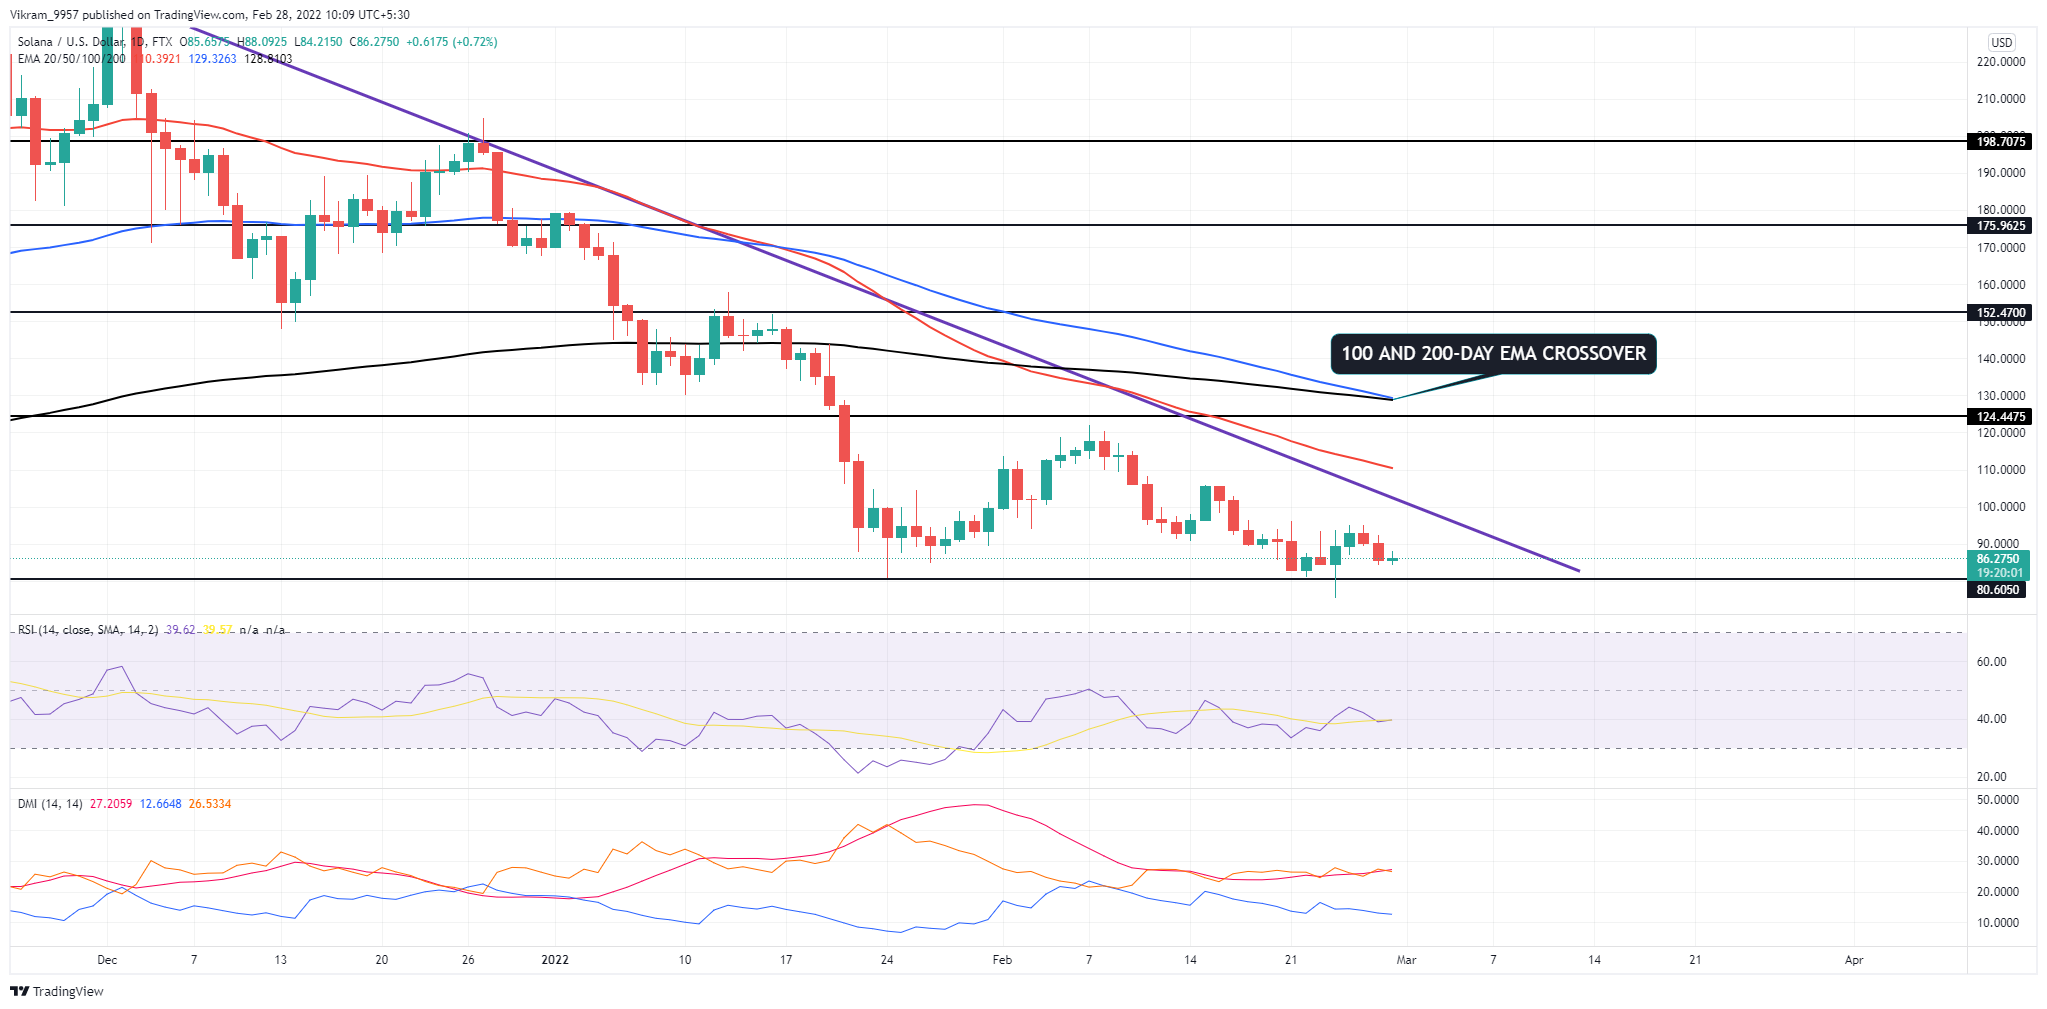 Source-Tradingview
SOL Technical Analysis
The lower price rejection at $80, with the recent reversal, marks the failure of the head and shoulder. Hence, further continuation towards the resistance trendline reflects a bullish sneak attack in action. The SOL coin price chart shows the crucial EMAs- 50, 100, and 200 striving to achieve bearish alignment, which will soon be complete with the bearish crossover. Moreover, the constant rejection from the 50-day EMA can be the upcoming trendsetter. The DMI indicator shows the DI lines maintain the bearish growth after the recent fake bullish crossover. Moreover, the ADX line projects a slow uptrend with the lingering -DI line. Hence, the indicator showcases a high momentum downtrend in action. The RSI Indicator slope lingers within the nearly oversold zone, struggling to surpass the 50% line. The RSI slope shows a bullish divergence in the last few dips at the $80 support level. In conclusion, the SOL technical analysis suggests a bullish breakout of the long-coming resistance trendline.
Upcoming Trend
The SOL coin price bottles up the potential descending triangle pattern in the daily chart. Hence, the breakout opportunity seems just around the corner, with the uptrend hinting at a 40% jump. However, the bulls must outperform the 50-day EMA to gain the extra bullish edge. Support Levels: $80 and $60 Resistance Levels: $100 and $120