
Monday's trading session is painting the crypto market with a bit of green, but before you start planning your Lambo order, check the charts—they urge a more cautious approach.
The overall crypto market capitalization stands at $3.08 trillion, according to CoinMarketCap, about 1% lower than yesterday but at least still within the $3 trillion territory that bulls had been desperately defending. Also, the Crypto Fear and Greed Index has clawed its way up to 24—still firmly in "Fear" territory—but that's a recovery from the “Extreme Fear” readings of 10 that we saw in late November when Bitcoin was flirting with $80,000.
The broader picture? We're in a post-all-time-high bearish correction that could be settling into something more prolonged.
Both Bitcoin and Ethereum have confirmed death crosses—that ominous technical pattern where the 50-day moving average falls below the 200-day mark. If history is any guide, and it often is, then next year could be shaping up as a crypto winter. Then again, previous death crosses in this cycle have marked local bottoms rather than cliff edges. The jury's still out.
On the macro front, traders are betting on nearly 90% probability of a Federal Reserve rate cut this Wednesday, according to FedWatch data. Lower rates typically make risk assets like crypto more attractive compared to bonds, but whether that's enough to reverse the technical damage remains to be seen.
Bitcoin: The $90K battleground
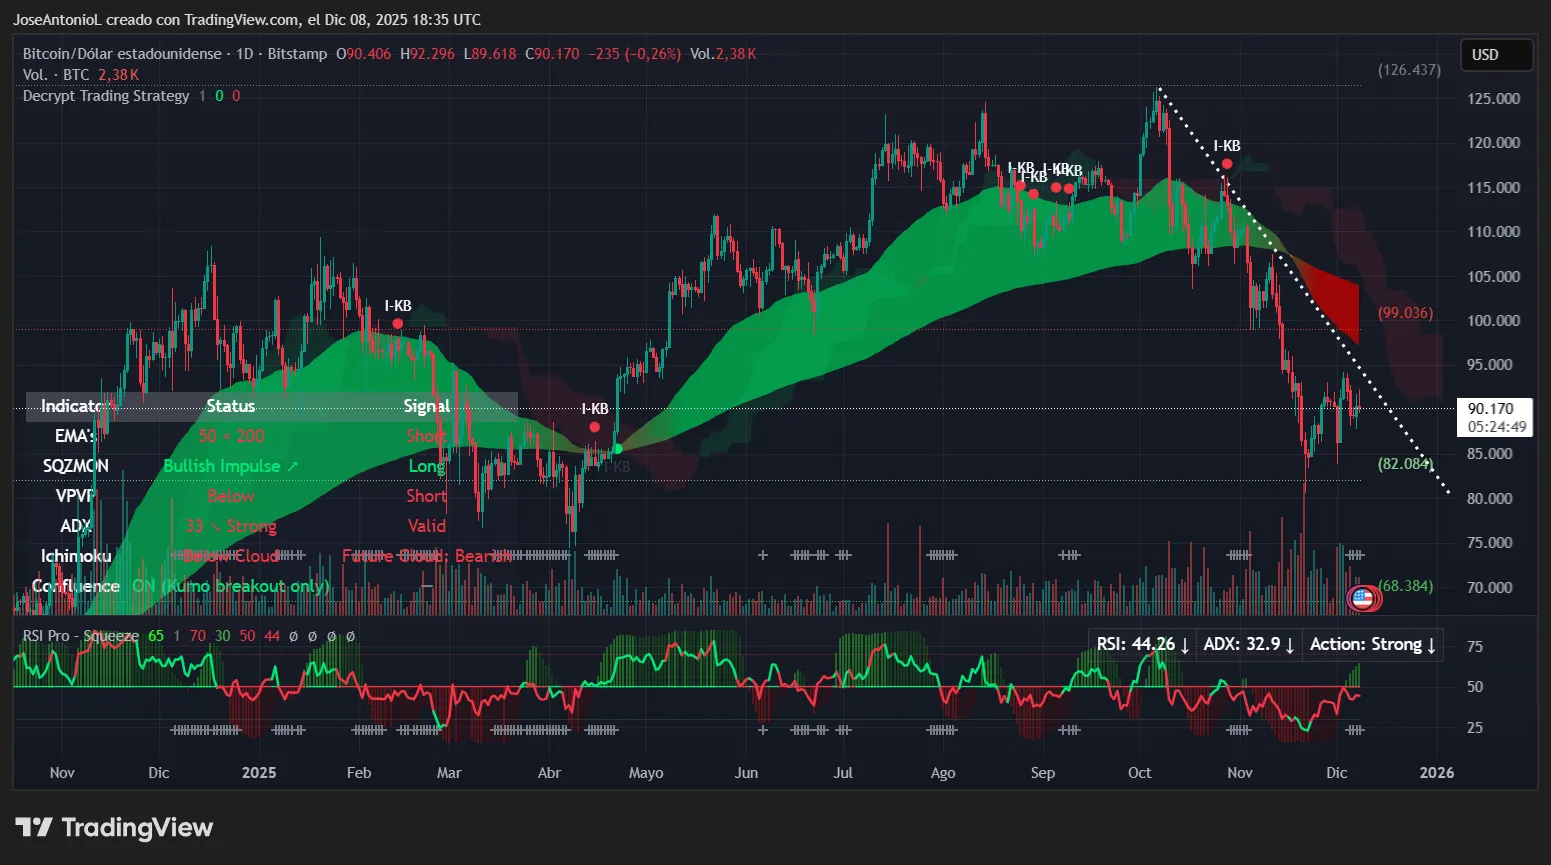
Bitcoin was recently trading at $90,170, down a modest 0.26% on the day but up 6.4% over the past 7 days. The flagship cryptocurrency touched an intraday high of $92,296, and found support at $89,618. Nothing dramatic, but it still shows how bears have a hand to play even in a small recovery.
Bitcoin's EMAs are in bearish alignment: The 50-day mark is trading below the 200-day level, confirming the death cross that formed on November 16 with prices way beyond the EMA50 resistance. The Ichimoku clouds—another complex indicator that aims at predicting future prices based on previous movements—signal a bearish setup for the immediate future, so things don’t look great even if prices are jumping.
The Average Directional Index (ADX) sits at 32.9, which is arguably strong trend territory—anything above 25 confirms a trend is in place, and above 30 means it's picking up steam. Right now, that trend is currently pointing down. The ADX doesn't tell you direction, just strength. Combined with the bearish EMA setup, this suggests the downtrend has conviction behind it.
The Relative Strength Index (RSI) reads 44.26, firmly in neutral territory—not oversold enough to attract bargain hunters, but not overbought enough to trigger profit-taking. It's that mushy middle ground where neither bulls nor bears have a clear edge.
The Squeeze Momentum Indicator is showing a bullish impulse in a compression zone, which means there will be a tug of war between bulls and bears in this zone, probably trying to break the resistance that has been forming for weeks and is apparent in the charts as the dotted white line.
Key levels to watch:
- Resistance: $99,036 (immediate), $105,000 (strong/200 EMA)
- Support: $82,084 (immediate), $68,384 (strong)
Ethereum: The $3,000 question
Ethereum is having a slightly better day than its bigger sibling, recently trading at $3,112, up 1.7% in the last 24 hours. The second-largest cryptocurrency by market cap opened at $3,060.6, reached a high of $3,180, and found its floor at $3,041, reclaiming the psychological level of $3K for a while.
This is a nice 14% rise in the weekly candlestick charts.
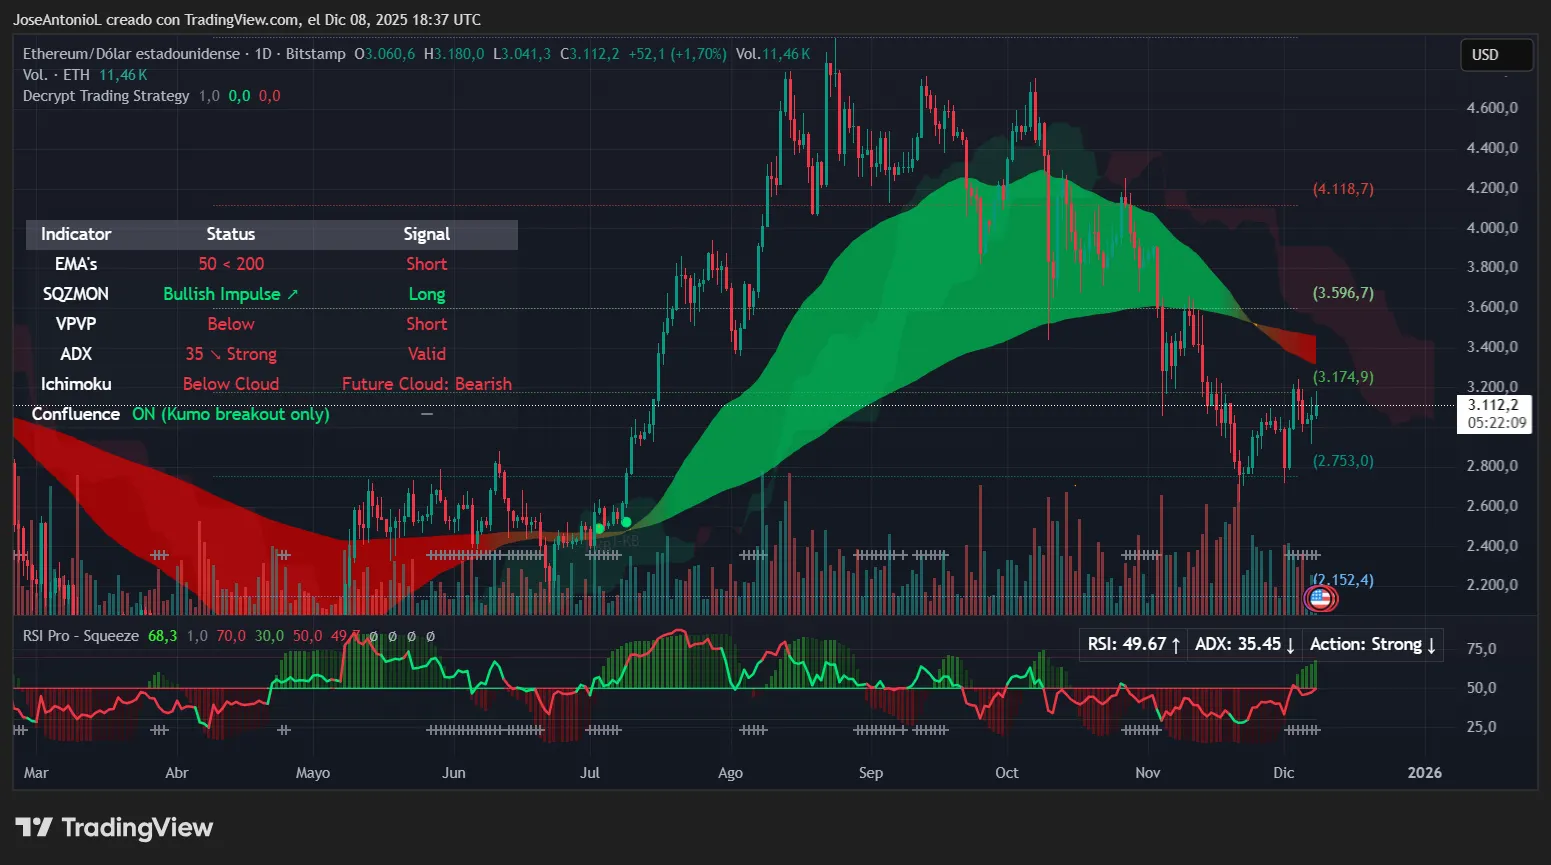
Like Bitcoin, Ethereum is trading under death cross conditions—the 50-day EMA sits below the 200-day mark, signaling that short-term momentum has been weaker than long-term trends. The ADX at 35.45 confirms there's a strong bearish trend in play, all things considered.
The RSI at 49.67 is essentially neutral, ticking slightly upward, which at least suggests that sell pressure is easing. The Squeeze Momentum Indicator is flashing a bullish impulse, hinting that compression in the market could resolve to the upside. That said, ETH is trading below the cloud with a bearish future cloud projection. When multiple indicators conflict like this, it typically means the market hasn't made up its mind yet.
What should traders watch? The $3,174 level (0.5 Fibonacci) serves as immediate resistance—ETH is essentially testing this zone right now. Above that, $3,596 represents the 0.382 retracement and a more significant hurdle as it is also the level in which the death cross was formed.
Key Levels:
- Resistance: $3,174 (immediate), $3,596 (strong)
- Support: $2,753 (immediate), $2,152 (strong)
The Fed decision on Wednesday could inject some volatility, and if rate cuts materialize as expected, then we might see a relief rally. But until BTC reclaims that 200-day EMA around $105,000 and ETH punches through its cloud resistance, this remains a bear market bounce until proven otherwise.
Disclaimer
The views and opinions expressed by the author are for informational purposes only and do not constitute financial, investment, or other advice.