
Toncoin price today trades near $1.58, stabilizing after a multi-month decline that broke both horizontal support and trendline structure earlier in the quarter. The asset remains beneath major moving averages and within a well-defined downward channel, but recent price action shows buyers attempting to build a base and defend short-term support.
AlphaTON Raises Eyebrows With $420M Plan As Market Stays Cautious
The rally attempts are emerging in the same week that Toncoin’s ecosystem received an unexpected corporate catalyst, with AlphaTON Capital announcing a fundraising plan sized at $420.69 million, a meme-encoded figure intended to capture attention and amplify narrative.
Market participants reacted to the filing with curiosity rather than conviction. AlphaTON currently has a market cap near $13 million, yet it is positioning to raise capital amounts normally associated with mid-cap tech. The company also holds 12.8 million $TON tokens, worth about $20.5 million, and plans to expand treasury holdings if its raise is successful. The announcement pushed the firm’s stock higher by roughly 14.7%, but that enthusiasm has not yet translated into broader $TON spot flows, which remain fragile after a heavy month of outflows across the digital asset treasury sector.
Price Stalls Beneath Major Resistance As Downtrend Remains Intact
The daily chart shows $TON locked beneath a declining trendline that originates from the early September swing high. The rejection sequence that began near $2.70 pushed price into a controlled downtrend, with lower highs and lower lows forming a consistent structure. The breakdown accelerated in October, with a violent selloff that forced price into a steeper decline channel.
Recent sessions show attempts to stabilize near the $1.44–$1.52 zone, but upside progress remains limited by the cluster of moving averages above price. Key levels include the 20-day EMA at $1.59, the 50-day EMA at $1.76, and the 100-day EMA at $1.90. All are sloping downward, forming a layered ceiling that has rejected each rally attempt.
The 200-day EMA at $2.69 stands as the major reversal threshold. Trend control does not shift until $TON breaks and holds above this level. For now, the chart reflects defensive positioning rather than structural recovery.
Bollinger Bands support this interpretation. Price remains lodged near the lower half of the band, suggesting that volatility expansion to the upside has not materialized. Without expansion, breakout attempts lack energy.
Triangle Compression Shows Neutral Momentum With Path To Break Either Way
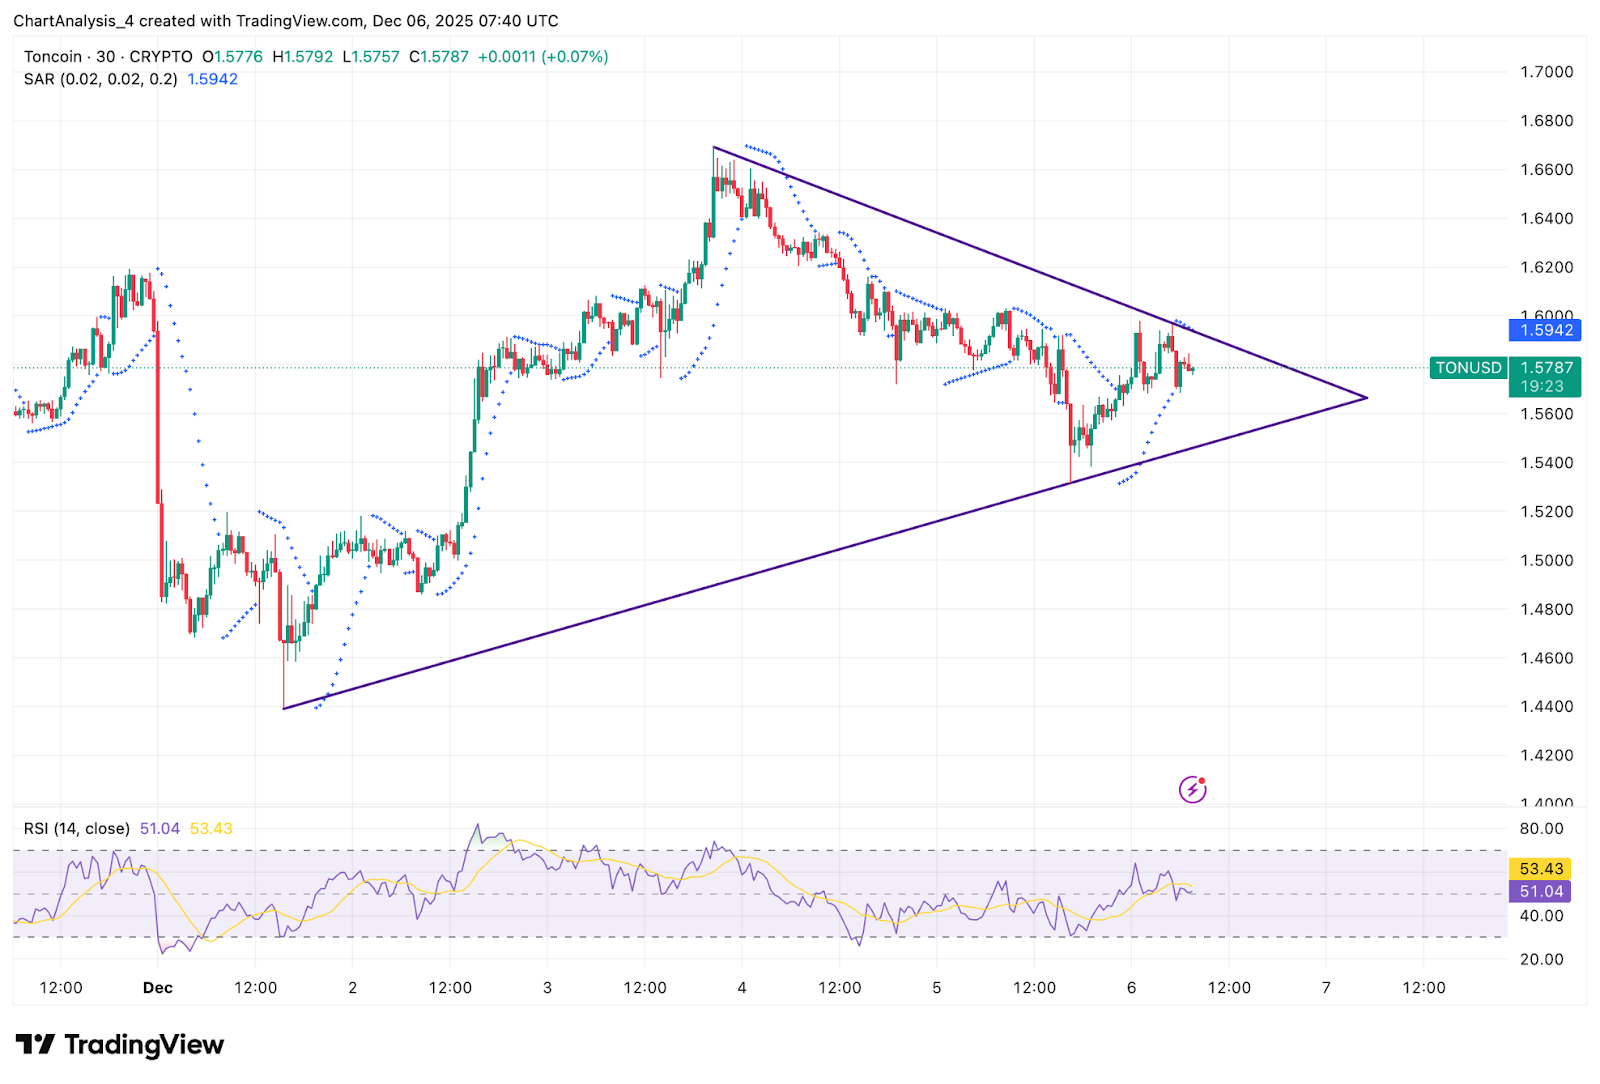
On the 30-minute chart, $TON is compressing inside a symmetrical triangle, with buyers attempting to create ascending support while sellers defend the upper boundary near $1.60–$1.62. This setup typically resolves with a directional break, but positioning suggests a tug-of-war rather than dominance by either side.
Parabolic SAR readings remain beneath price, favoring upward pressure in the short term. However, the slope of the SAR dots suggests a fragile trend, not an established rally. The asset must break above $1.62 with continuation to confirm any breakout attempt.
Support on this timeframe sits at $1.55, with deeper structural support at $1.52. A breakdown below that support exposes the recent low at $1.44, where buyers previously stepped in with conviction. Without a break of the upper triangle boundary, price continues to coil and build energy rather than trend.
RSI remains neutral at 51, reflecting cautious momentum. This is not overbought or exhausted. It is hesitation.
Spot Flows Remain Weak As Treasury Activity Slows
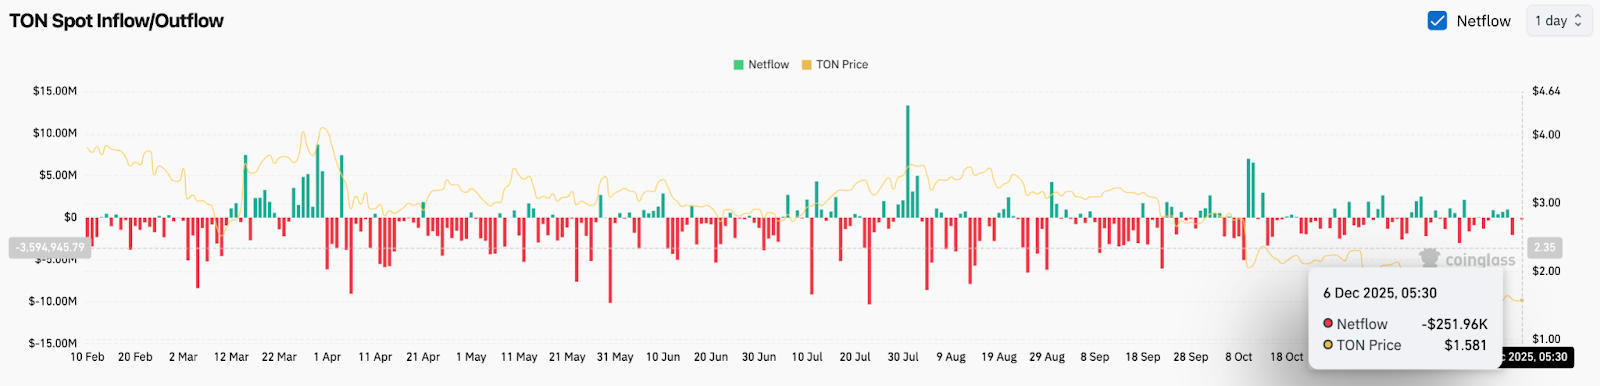
Coinglass data shows persistent outflows throughout the quarter, with November marking one of the weakest months for digital asset treasury allocations in 2025.
Toncoin saw net outflows of -$252,000 in Decemmber 5 session, extending a broader pattern of liquidity leaving the ecosystem rather than entering it.
Outlook: Will Toncoin Go Up?
$TON sits at a technical crossroads. Buyers are attempting to build a base, but the asset remains trapped beneath every important moving average and a long-term downtrend line.
- Bullish case: A breakout above $1.62 opens a move toward $1.76 and the 50-day EMA. Surging volume would be needed to extend toward $1.90, where a more meaningful test occurs. Reclaiming and holding the 200-day EMA at $2.69 shifts the trend from defensive to constructive.
- Bearish case: A breakdown below $1.52 exposes $1.44, and loss of that level invites continuation toward $1.30–$1.20 as the channel continues lower. Lack of inflows accelerates downside risk.
Disclaimer: The information presented in this article is for informational and educational purposes only. The article does not constitute financial advice or advice of any kind. Coin Edition is not responsible for any losses incurred as a result of the utilization of content, products, or services mentioned. Readers are advised to exercise caution before taking any action related to the company.