$HBAR price is up about 2.2% today while the broader crypto market gains more than 3.5%. 7-day performance is flat, and the token is still down 37% over the past three months.
That gap raises the core question behind the title: is $HBAR simply late to the bounce (provided it holds), or is it showing signs it may not join at all?
Early Trend Signals Suggest a Late Entry, but Demand Signals Push the Other Way
The first hint that $HBAR might be late rather than absent comes from the 4-hour chart. The 20-period Exponential Moving Average (EMA), which tracks short-term trend direction, has almost crossed above the 50-period EMA, a medium-term guide.
The last time this bullish crossover completed on November 10, $HBAR climbed almost 10%. That same setup is flashing again, which usually marks the start of a catch-up move for lagging tokens. One similar bounce could give the $HBAR price some strength. That could amplify if the price crosses above the 100-period EMA (sky blue line), a key historical resistance level.
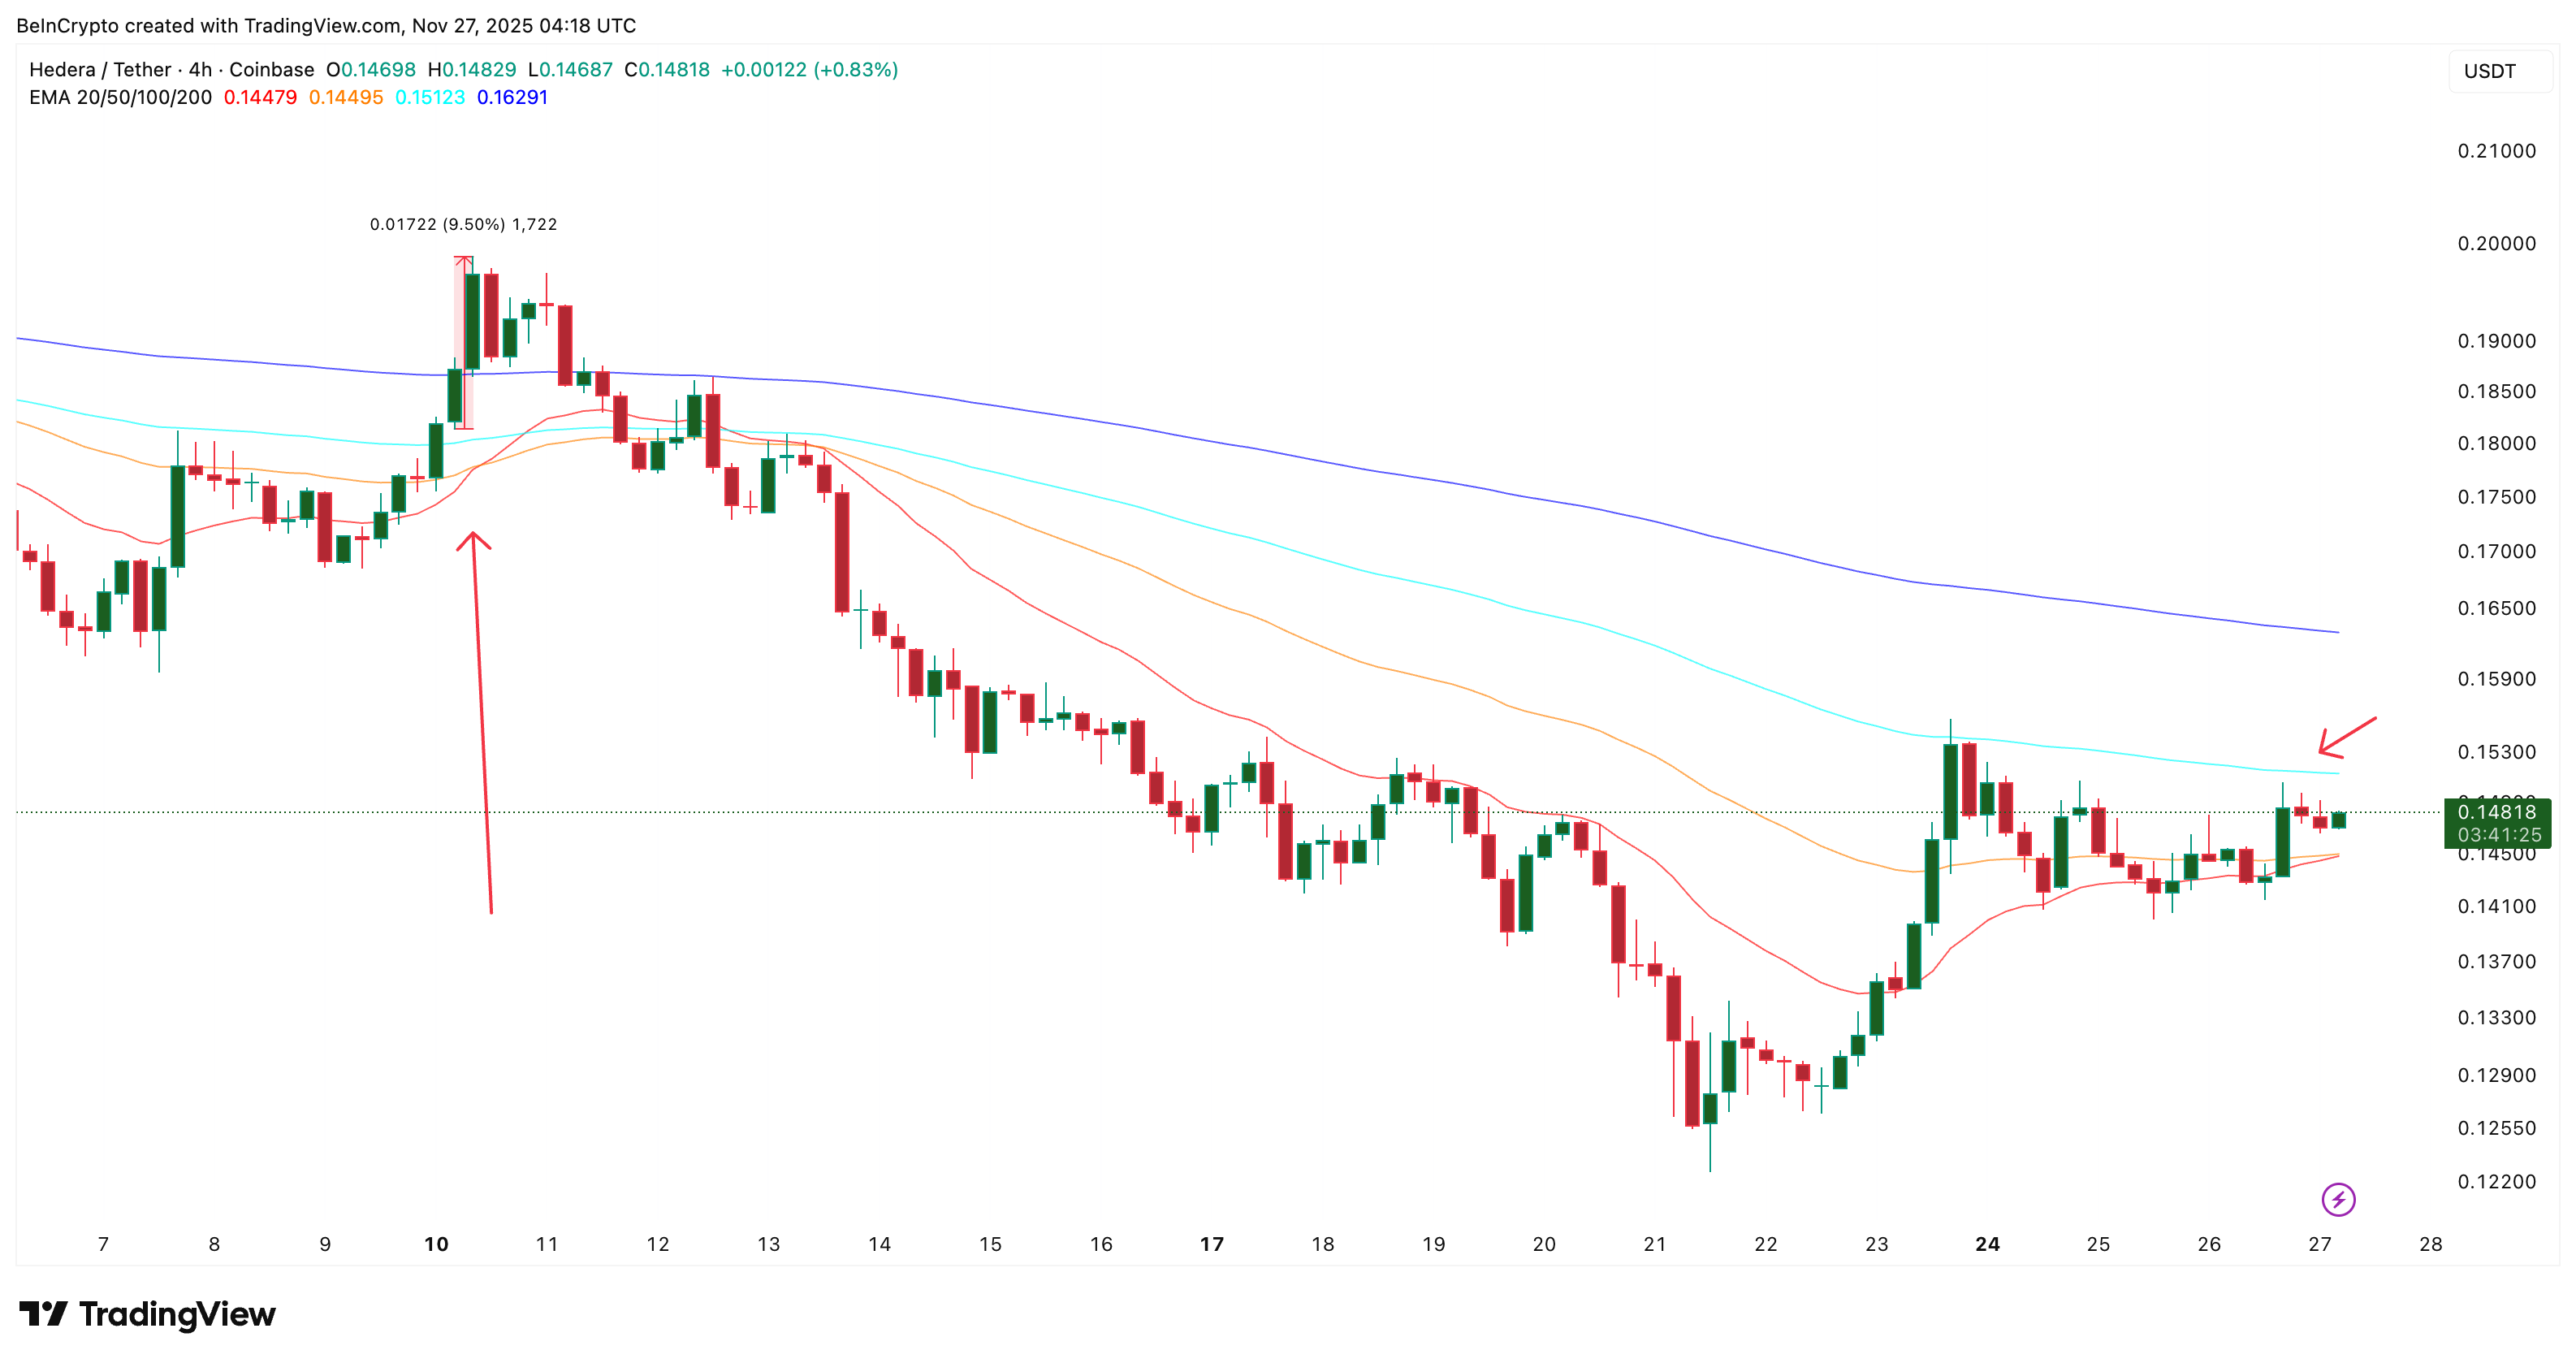 $HBAR Price Action (4-Hour Chart)">
Want more token insights like this? Sign up for Editor Harsh Notariya’s Daily Crypto Newsletter here.
But demand signals tell a different story. Spot flow has weakened sharply.
On November 24, netflows were close to -$5 million (net buying). Yet, today the netflow sits above +$102,000 (net selling). Even with price lifting, buyers are not stepping in. This shows traders are selling into strength, not positioning for a full recovery.
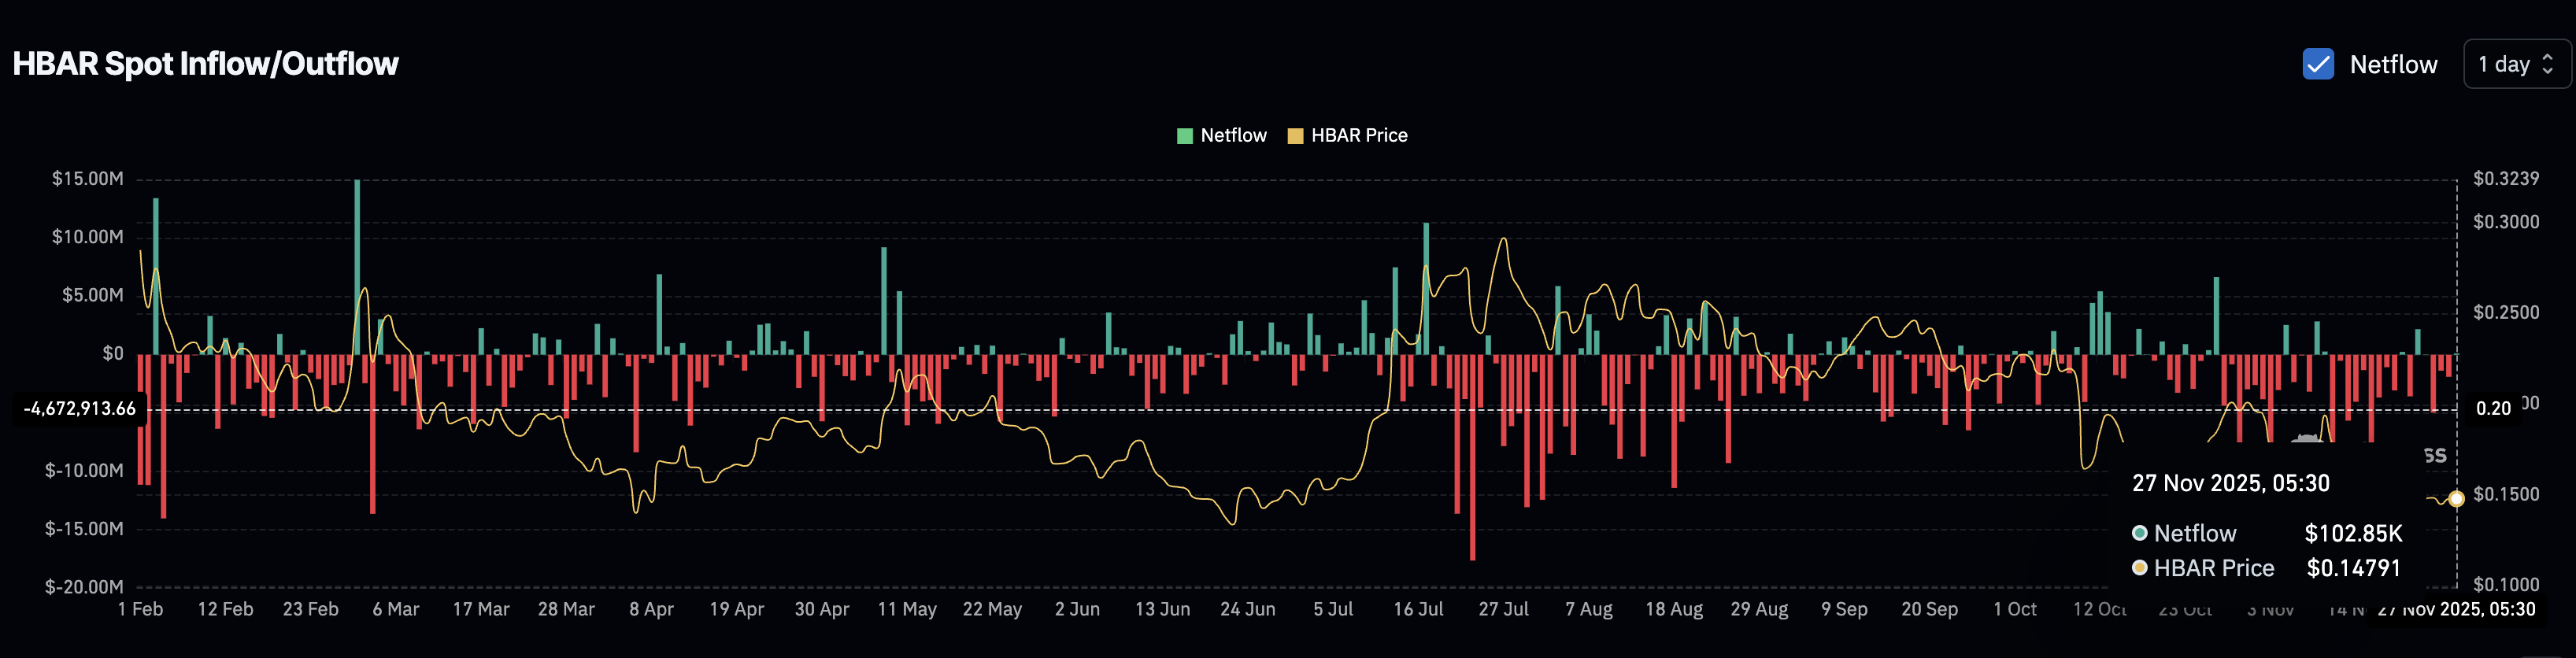
A token that is “late to the party” usually attracts fresh demand. $HBAR isn’t showing that yet. Volume confirms the hesitation.
On-Balance Volume (OBV), which tracks whether real buying volume supports a move, still shows a bearish divergence. Between October 10 and November 21, the $HBAR price formed a higher low while OBV made a lower low.
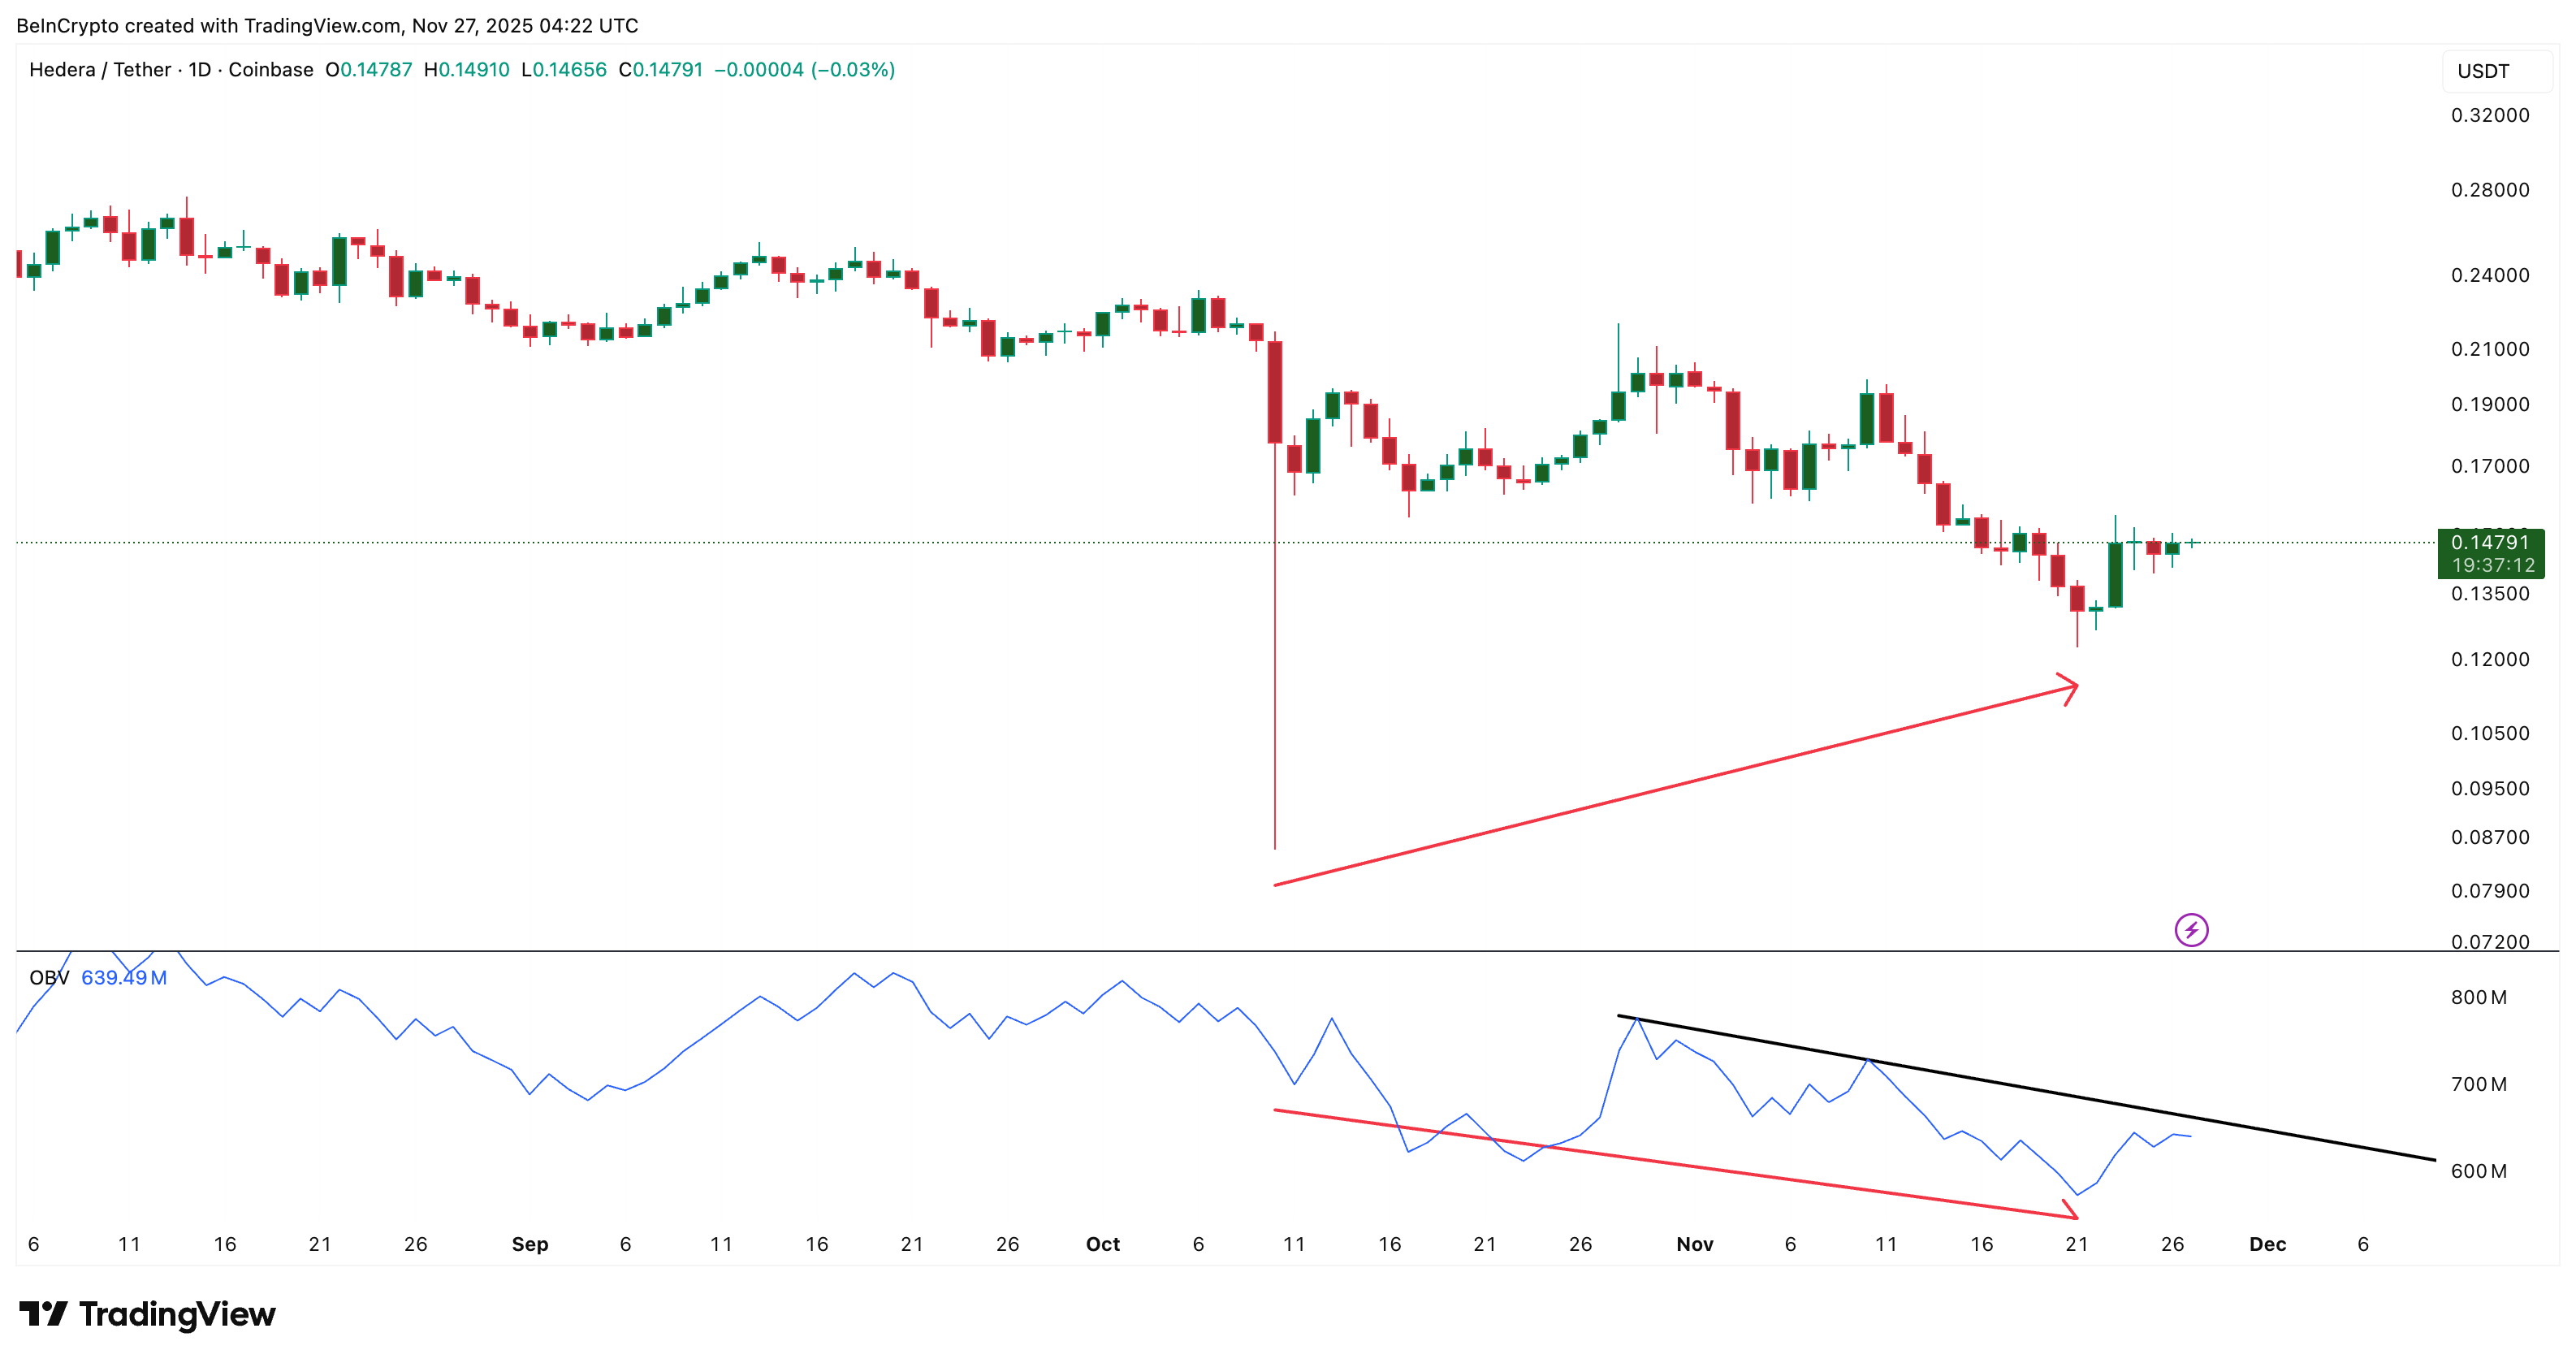
That means the recent bounce isn’t backed by stronger volume. OBV is now closing in on its descending trendline.
A breakout above that line would show that buyers are finally returning. But as long as OBV stays below it, $HBAR leans toward the “not joining at all” side of the title.
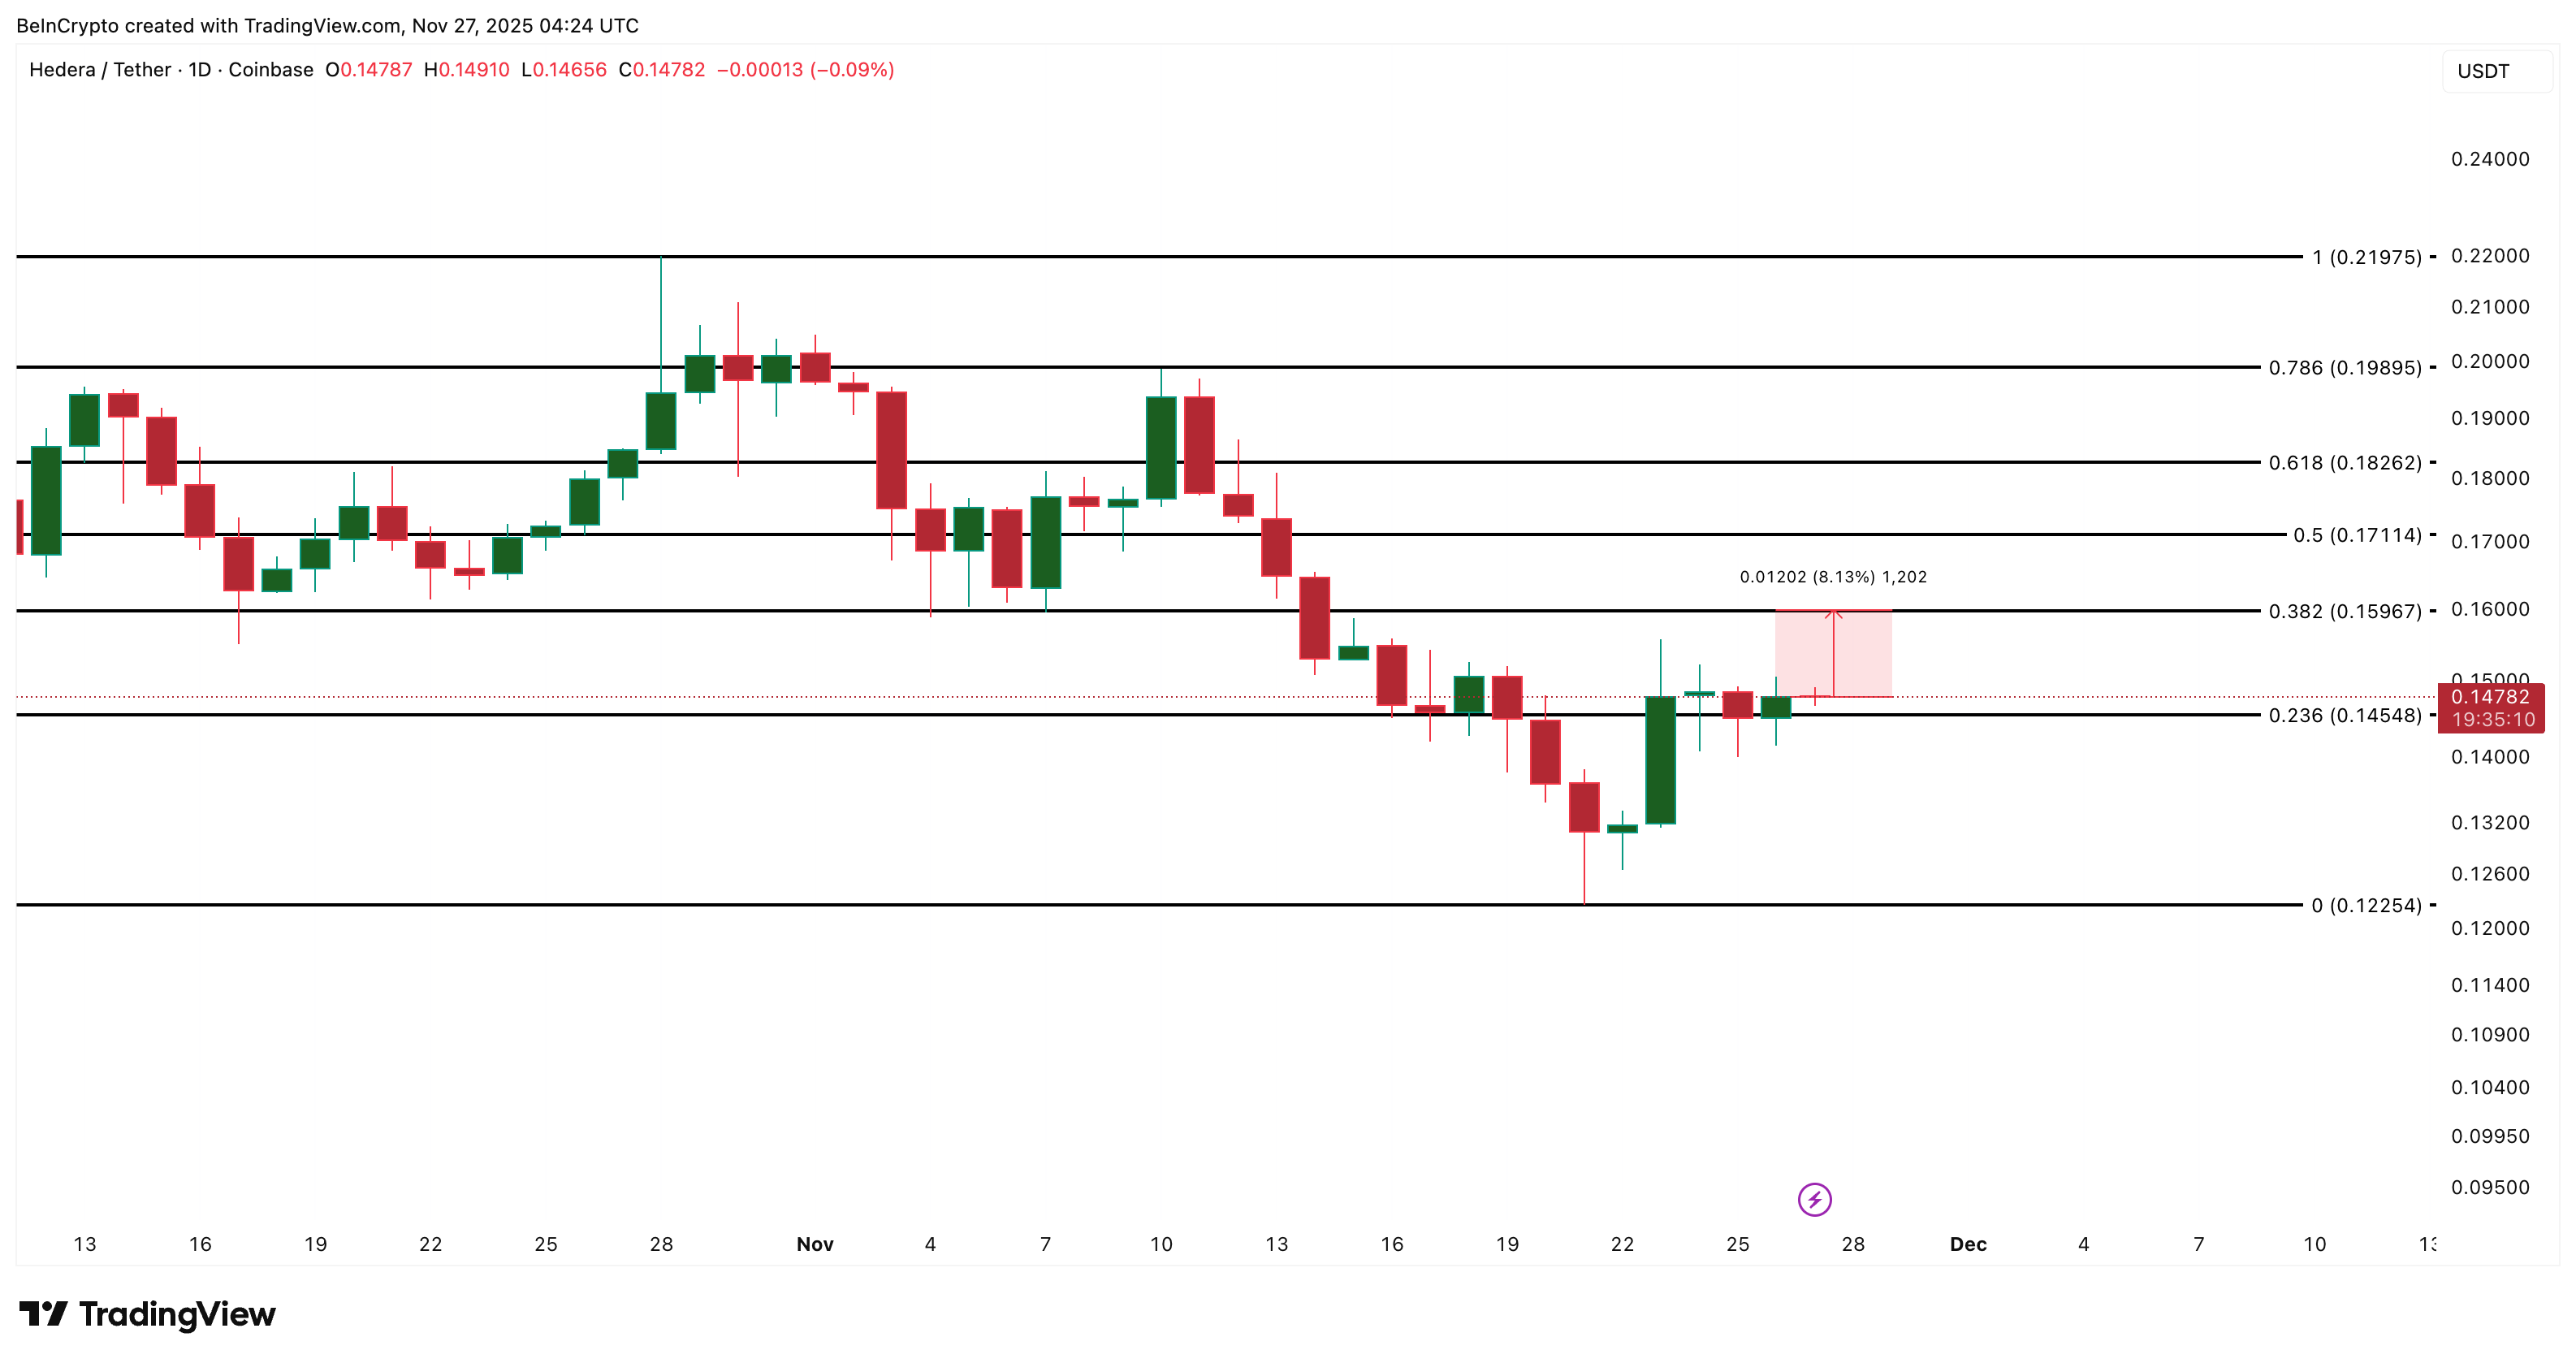
$HBAR Price Levels Decide The Next Move?
All $HBAR price signals converge on one key zone: $0.159.
The four-hour EMA setup can push $HBAR price higher, but a daily close above $0.159 is the minimum proof that sellers are backing off. Only then can $HBAR aim for $0.182 and $0.198, which would confirm it is starting to align with the wider crypto bounce, provided it lasts.
If $HBAR fails to hold $0.145, the entire narrative shifts back to bearish.
 $HBAR Price Analysis">
A drop below that level exposes $0.122, especially if spot selling persists and OBV fails to break its trendline. That would fit the “not joining at all” scenario — a token slipping even as the rest of the market recovers.
Right now, the short-term trend still says $HBAR is just late to the party. But weak spot inflows, a bearish OBV structure, and hesitant buyers mean it could still end up not joining at all.
$HBAR can catch up only if:
- OBV breaks its descending trendline,
- spot inflows strengthen, and
- price closes above $0.159.
Until these align, $HBAR remains one of the few major tokens trailing the broader crypto rally instead of following it.
The post $HBAR Price Lags the Market Bounce — Late to the Party or Not Joining at All? appeared first on BeInCrypto.