Dogecoin’s exchange dynamics have flipped at a key moment, with fresh on-chain data pointing to a shift in short-term market structure. Crypto analyst Ali Martinez (@ali_charts) highlighted a Glassnode chart showing that Dogecoin’s net supply on centralized exchanges has just turned positive, noting on X: “Dogecoin supply on exchanges just turned positive! This shift has marked sharp rebounds before.”
Dogecoin Rebound Loading?
The chart in his post, “$DOGE: Exchange Net Position Change – All Exchanges,” tracks monthly exchange inflows and outflows as a histogram, alongside $DOGE’s price in US dollars. Green bars indicate net inflows (more $DOGE moving to exchanges than leaving), while red bars show net outflows.
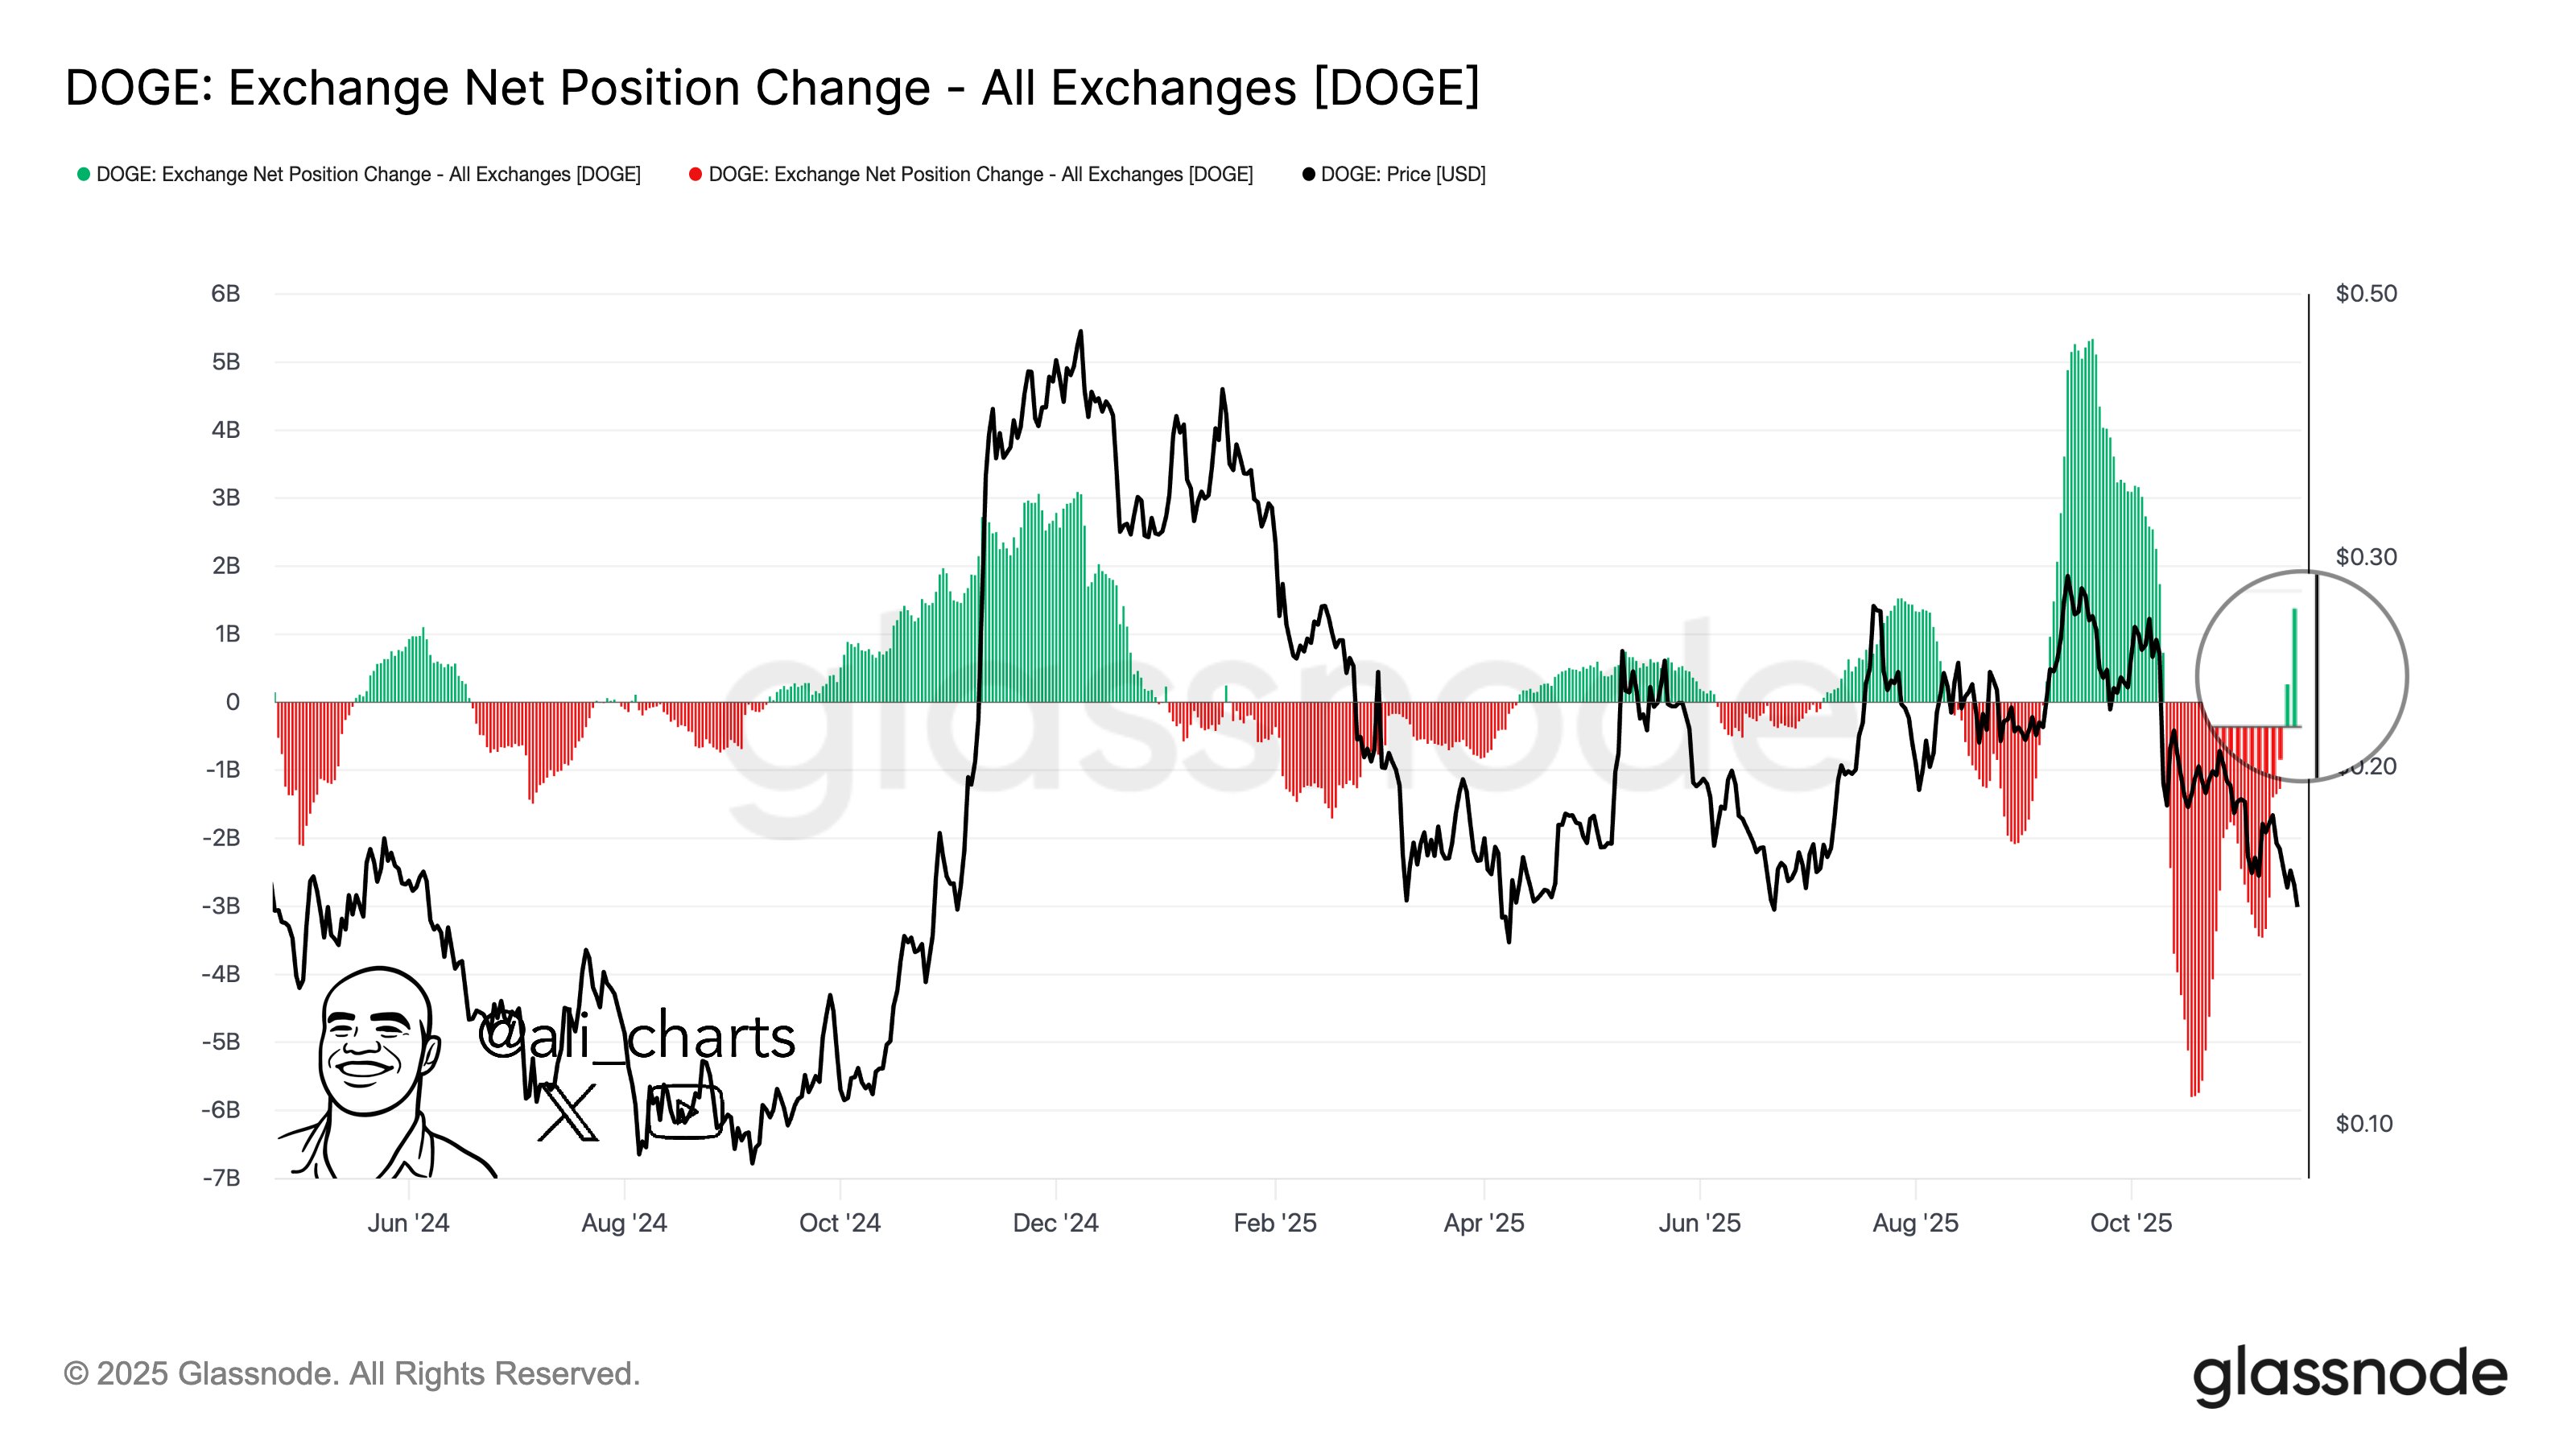
From mid-2024 through late 2024, the series alternates between modest red and green periods before a sustained cluster of strong green bars emerges around the fourth quarter of 2024. During that phase, net inflows rise to several billion $DOGE per month. At the same time, the price line accelerated from below $0.10 to a local peak to $0.48, illustrating how heavy exchange-side activity accompanied the rally.
After that peak, the structure changes. Through early and mid-2025, the histogram becomes more mixed, with smaller positive and negative reads as price oscillates broadly between roughly $0.12 and $0.30. Heading into late 2025, however, the chart shows a pronounced sequence of red bars, with net outflows extending down toward roughly −5 to −6 billion $DOGE while the price trends lower from the mid-$0.20s toward the low-$0.20s and below.
The final data point, emphasized by a circular highlight on the right edge of the chart, marks a clear break in that pattern: a tall green bar crosses back above the zero line, indicating that net flows have turned positive again. At that moment, the price line sits slightly above the $0.15 mark on the vertical scale. Martinez interprets this as a “major rebound signal,” pointing to previous instances where a similar transition from persistent outflows to strong inflows coincided with sharp directional moves.
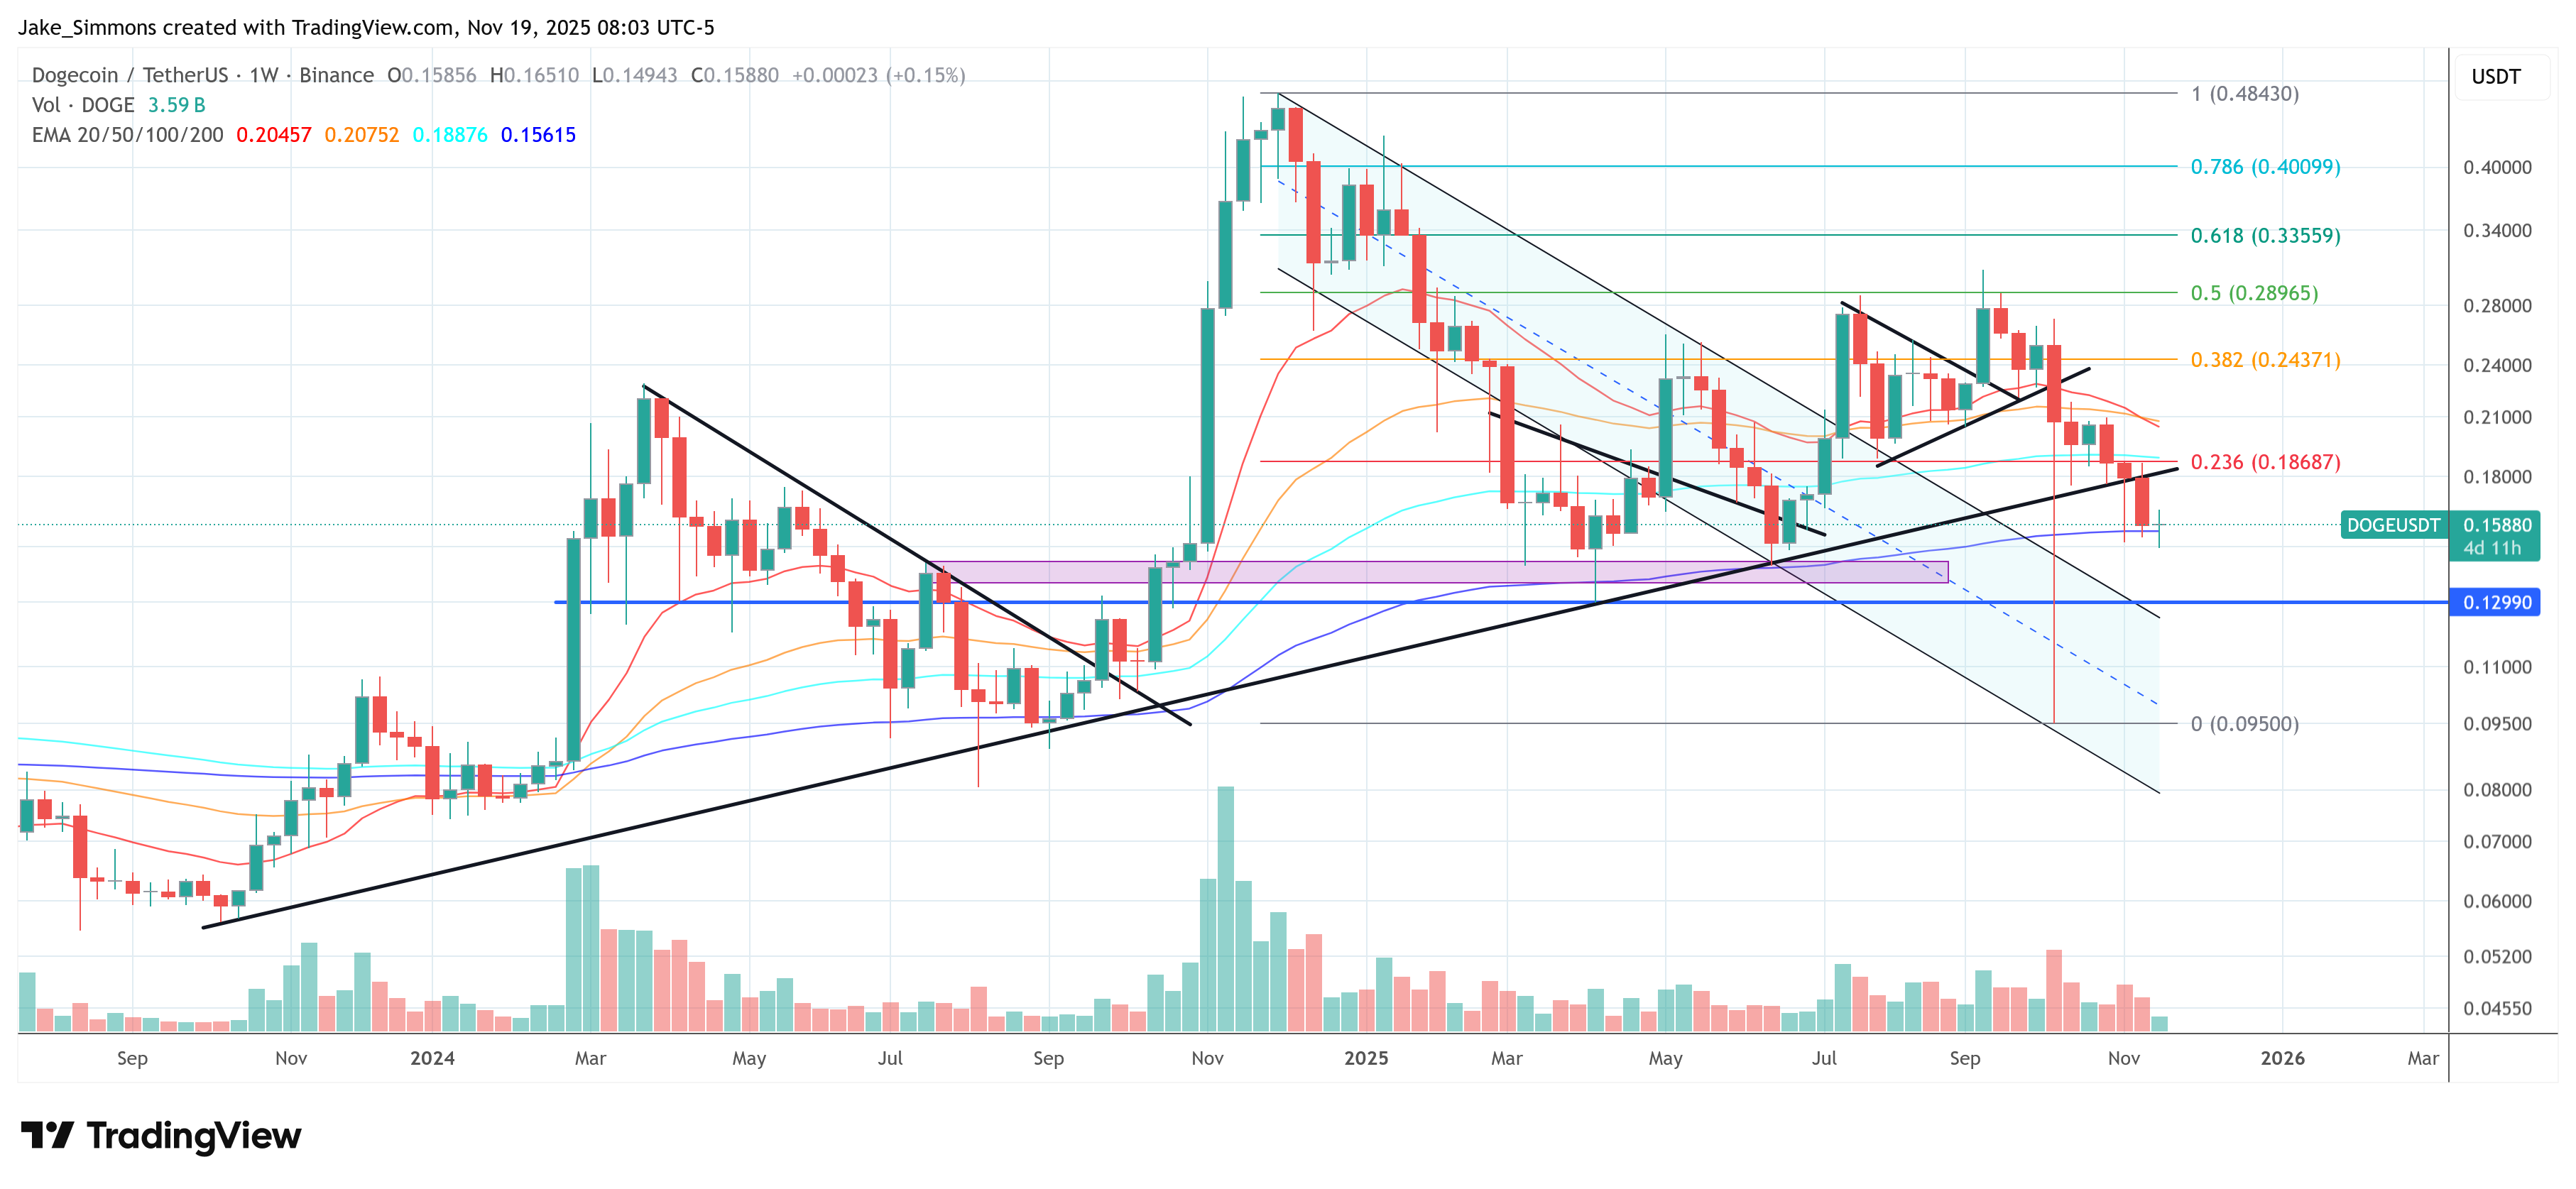
$DOGE On Thin Ice Below $0.16
A second chart he shared, an ATH-partitioned UTXO Realized Price Distribution (URPD), sets out where the current $DOGE supply last moved on-chain. A single, dominant bar appears around $0.07392452 and accounts for 28,260,298,271.803 $DOGE, or 18.62% of the measured supply. Martinez summarizes this by stating that 27.4 billion $DOGE have accumulated at roughly $0.08, calling it the “most significant support level.”
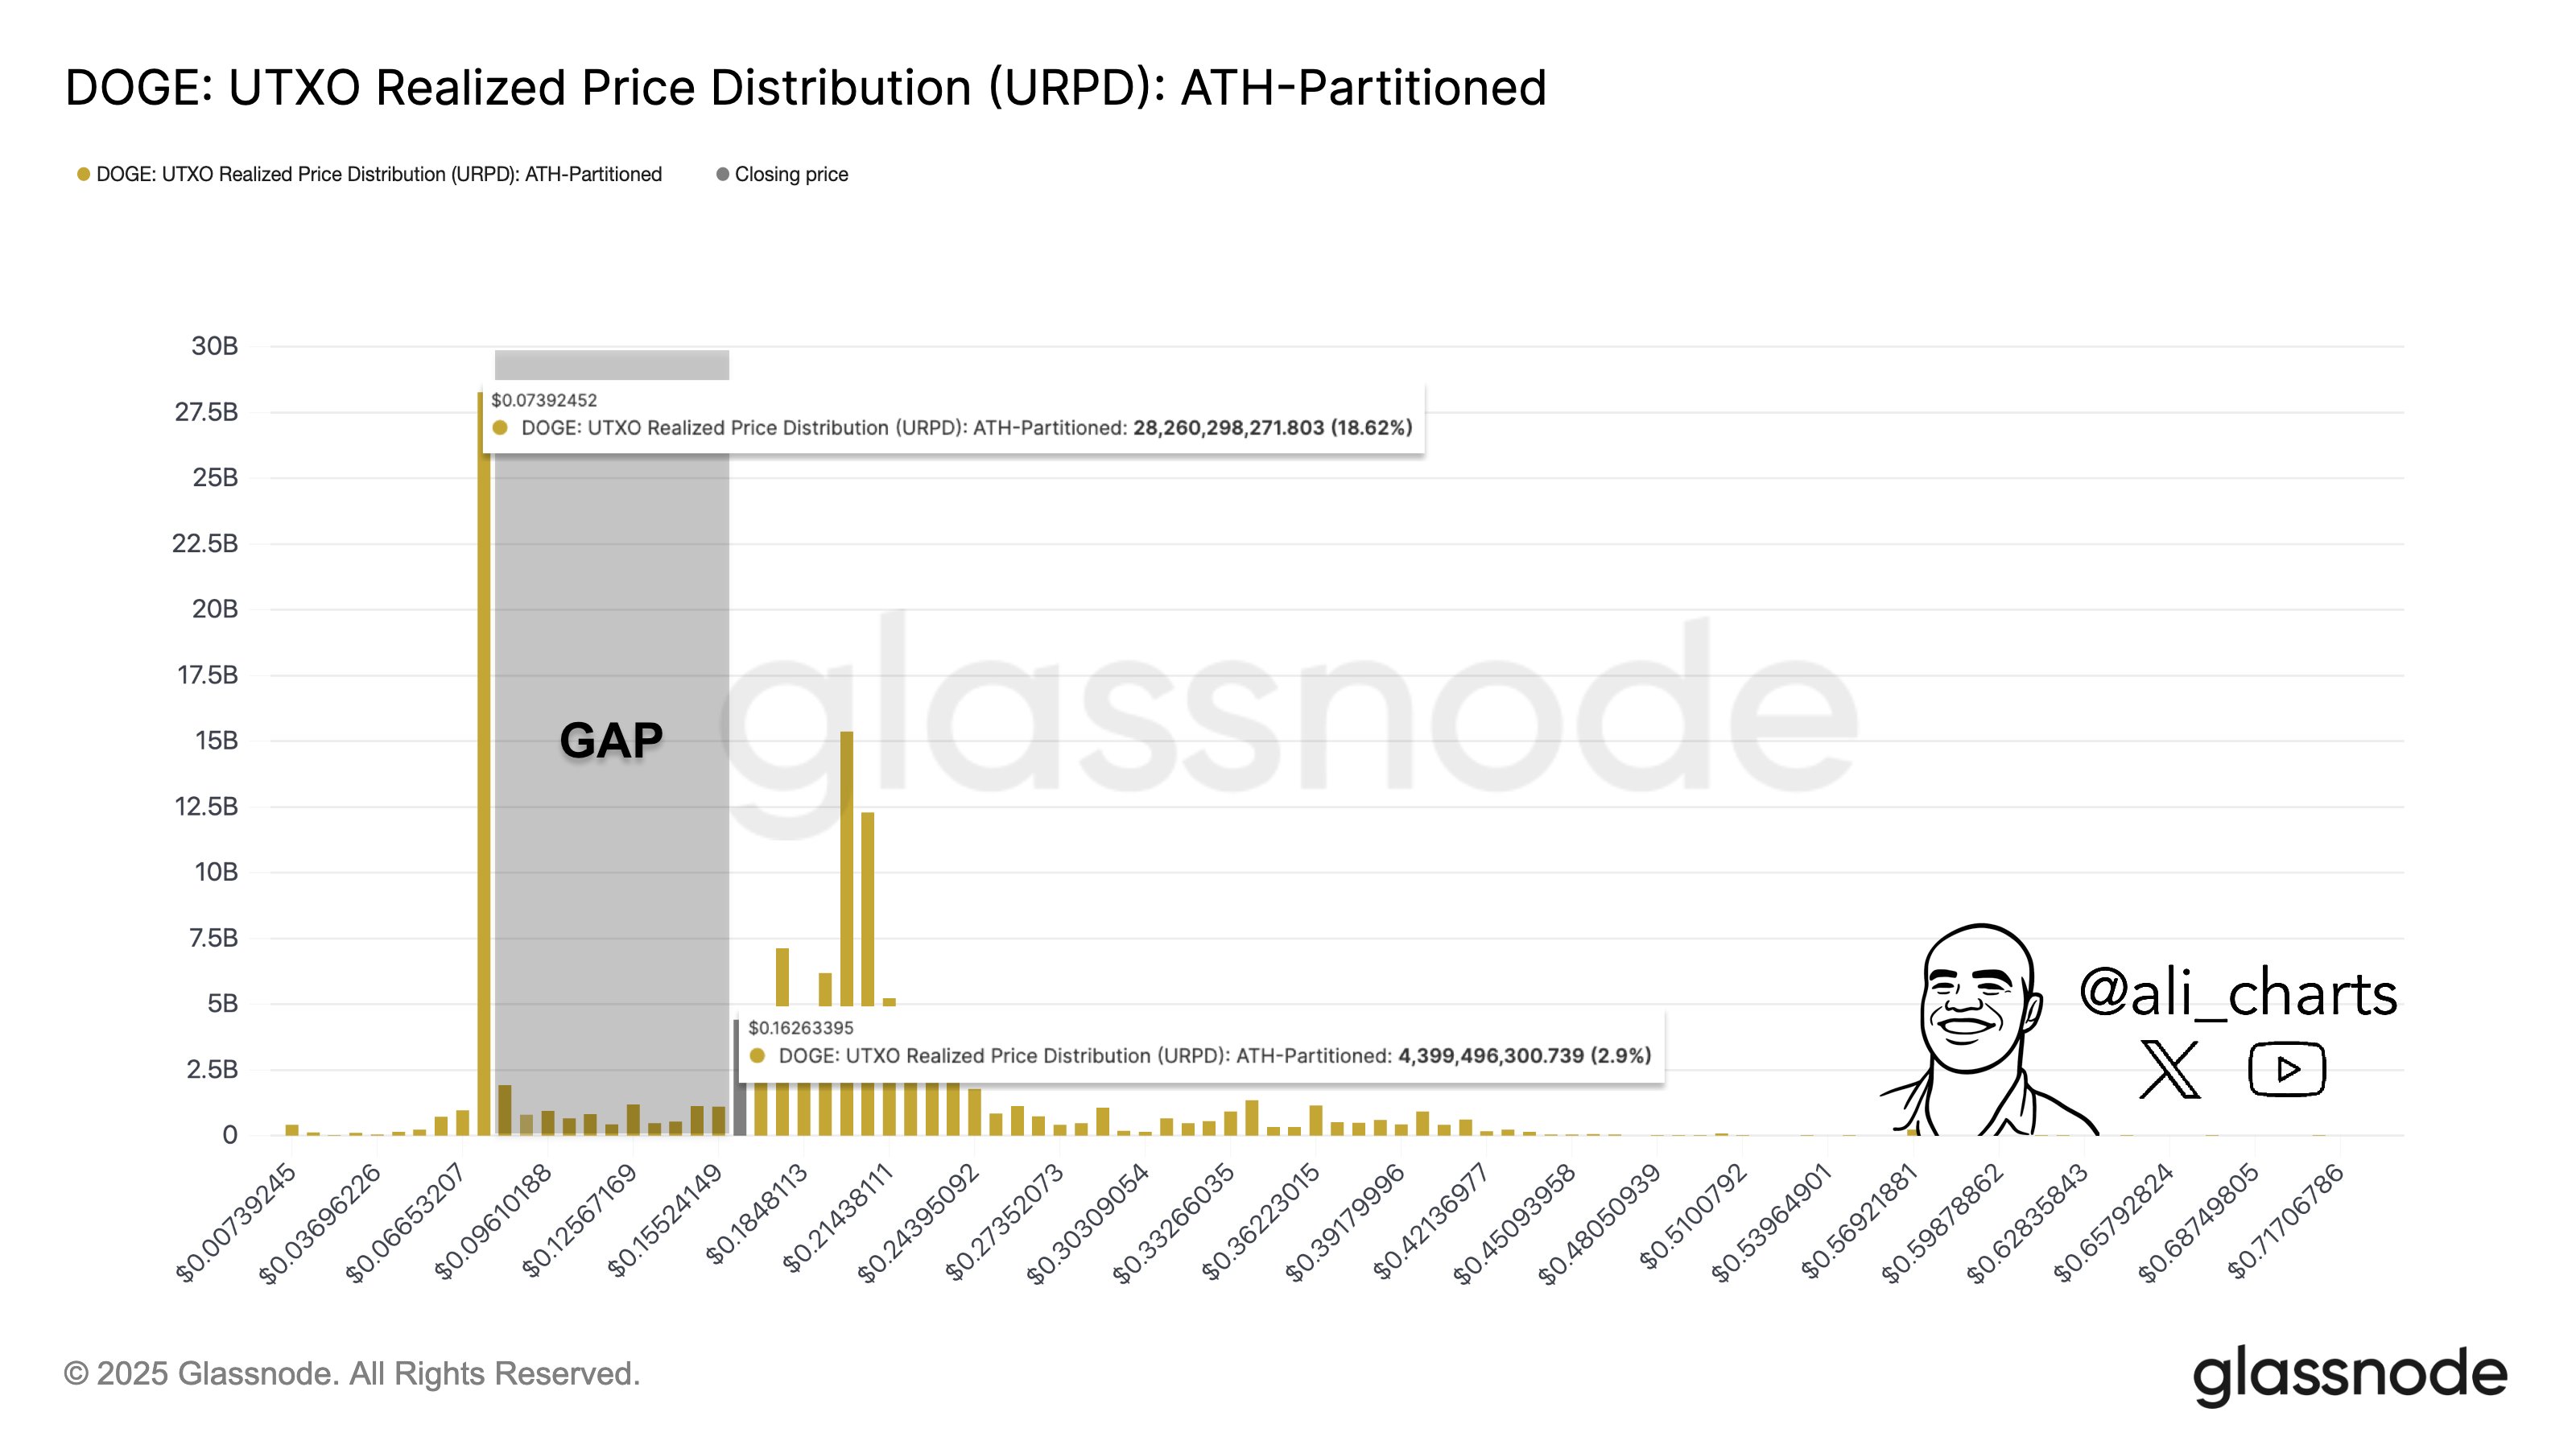
Between that $0.07–$0.08 block and approximately $0.16, the URPD shows a shaded “GAP” with only small intermediate bars around levels such as $0.096, $0.125 and $0.155. Above the gap, a smaller but still notable cluster appears at about $0.162633395, containing 4,399,496,300.739 $DOGE (2.9% of supply). “Below $0.16, support for Dogecoin $DOGE disappears quickly,” Martinez warns, adding that the “next real demand zone sits at $0.07.”
A third chart, a cost-basis distribution heatmap, tracks $DOGE’s price against horizontal bands representing where holders’ cost bases are concentrated. It confirms two core cohorts: a lower band between $0.0812497 and $0.08279775 with 27,397,971,652.123432 $DOGE, and an upper band from $0.20103297 to $0.20486326 containing 12,156,333,652.493444 $DOGE.
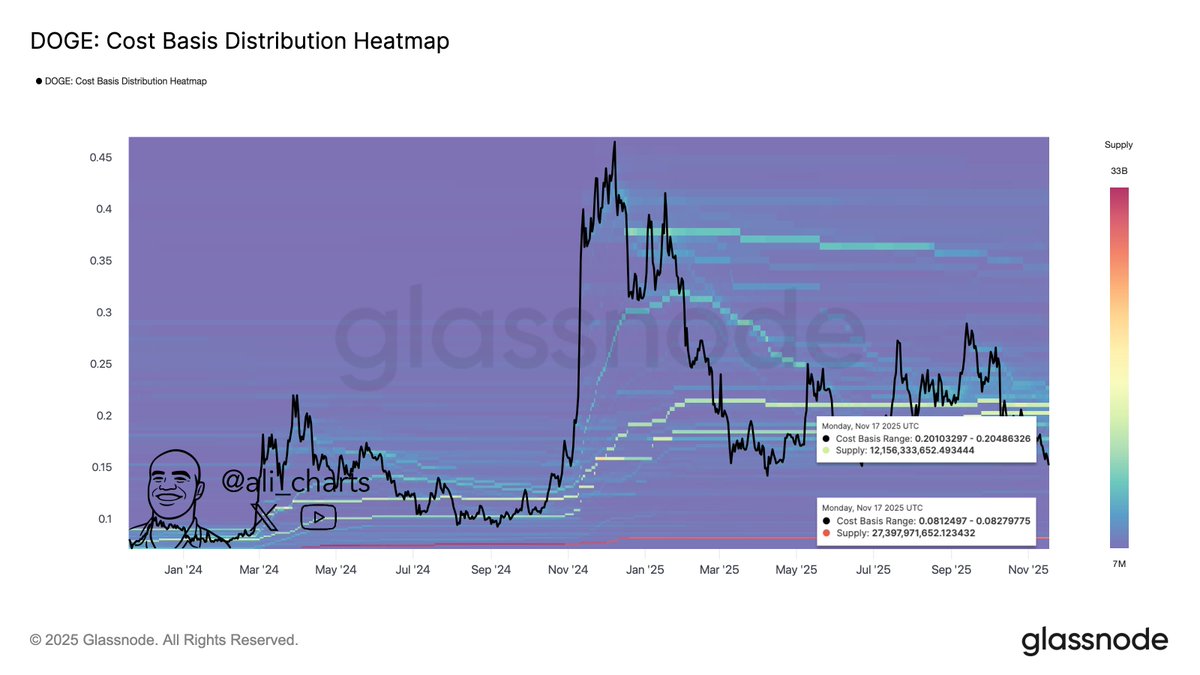
Together with the newly positive exchange flows, these data points define a market caught between a dense realized floor around $0.08 and a substantial holder cluster near $0.20, with the latest flow reversal now in focus for traders tracking $DOGE’s next move.
At press time, $DOGE traded at $0.158.