Summary
Summary
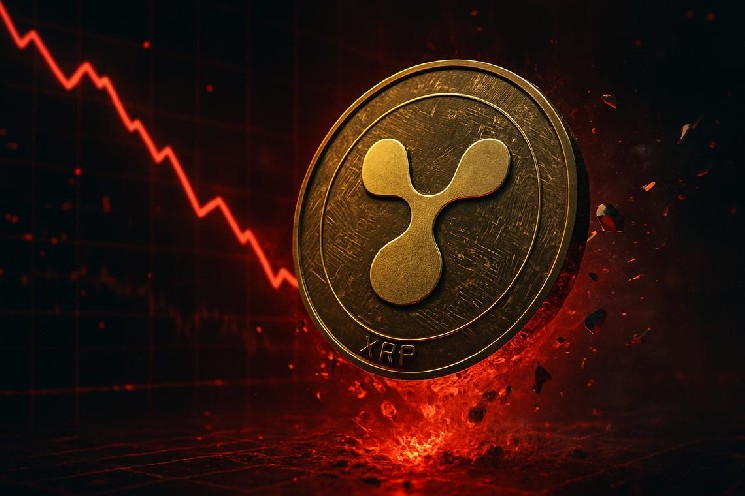
XRP is trading around 2.19 USDT, below its key daily moving averages, which signals a dominant bearish bias on the higher timeframe. The daily RSI sits in the high 30s, indicating weakened momentum but not yet a fully oversold washout. MACD on the same timeframe remains slightly negative, confirming that upside attempts still struggle to gain sustainable traction. Meanwhile, on the hourly and 15-minute charts, price is hovering close to short-term averages, pointing to a more balanced, range-bound regime. Market-wide, crypto capitalization has slipped over 3% in 24 hours as Bitcoin dominance climbs above 56%, reflecting risk aversion. With the global Fear & Greed Index deep in Extreme Fear, investors appear cautious, and short-term positioning in XRP looks tentative.
Ripple crypto: Market Context and Direction
The backdrop for XRP is shaped by a broader market that has turned defensive. Total crypto capitalization sits near 3.21 trillion dollars, down about 3.7% over the last day, which points to a phase of de-risking across major tokens. Moreover, Bitcoin dominance at roughly 56.7% shows that capital is rotating toward the perceived safety of the leading coin rather than spreading into altcoins.
This environment tends to weigh on assets like XRP because traders become more selective and less willing to chase rallies. The Fear & Greed Index at 11, firmly in Extreme Fear, reinforces that sentiment: many participants are focused on capital preservation rather than aggressive accumulation. That said, such extreme readings have historically coincided with phases where selling pressure can start to exhaust, laying the groundwork for later mean-reversion rebounds. For now, however, the primary direction for XRP on the daily chart remains tilted to the downside.
Technical Outlook: reading the overall setup
On the daily timeframe, XRP trades at 2.19, below the 20-day exponential moving average at 2.33, the 50-day at 2.48, and the 200-day at 2.64. This clear alignment of price under the three EMAs depicts a well-established downtrend structure, where sellers consistently regain control on attempts to bounce.
The daily RSI at 39.66 confirms this picture. It sits below the neutral 50 line yet above classic oversold levels, suggesting weak but not capitulated momentum. In other words, bears have the upper hand, but there is still room for further downside or sideways grinding before a strong contrarian reaction becomes more probable.
Daily MACD adds nuance: the line is slightly negative at -0.08, with the signal at -0.07 and a small negative histogram. This configuration indicates that downward momentum is present but not accelerating aggressively. It portrays a cooling bearish impulse, where the strongest phase of the sell-off may be losing steam, even if a clear bullish reversal is not yet visible.
Bollinger Bands on the daily chart are centered around 2.33, with an upper band near 2.57 and a lower band around 2.10. Price at 2.19 sits closer to the lower band, reflecting pressure toward the downside of the recent range. However, it is not hugging the band, which often signals trend exhaustion; instead, this suggests a controlled correction within a broader downward bias.
The ATR(14) at 0.17 points to moderate daily volatility. For traders, this implies that average swings are meaningful but not extreme, suggesting that any breakout setup above resistance or below support would likely be visible without sudden, erratic spikes.
Intraday Perspective and XRPUSDT token Momentum
Looking at the hourly chart, XRP trades at 2.19, essentially on top of the 20-period EMA at 2.18 and very close to the 50-period EMA at 2.20, while the 200-period EMA at 2.28 still looms overhead. This configuration portrays a short-term neutral regime within a broader daily downtrend: intraday participants are undecided, balancing supply and demand near current prices.
Meanwhile, hourly RSI at 51.13 sits almost exactly at the midpoint, confirming the lack of directional conviction. The hourly MACD line is marginally above its signal, and the histogram is slightly positive, hinting at a mild intraday bullish bias but with very limited strength.
On the 15-minute timeframe, price continues to hover at 2.19, slightly above the 20 and 50 EMAs at 2.17, while the 200 EMA at 2.20 caps the upside. The RSI around 60.36 reflects a modestly stronger momentum tilt for very short-term traders. As a result, scalpers may find small upside opportunities, yet the proximity of the longer moving average suggests these moves are unfolding inside a constrained consolidation rather than a decisive breakout.
Key Levels and Market Reactions
Daily pivot levels provide useful landmarks for the current structure. The main pivot point sits near 2.16, just below spot price, acting as an immediate reference for intraday bulls defending the area. Slightly above, the first resistance cluster emerges around 2.22, close to where sellers could attempt to reassert control if price bounces from current levels.
On the downside, initial support appears around 2.13. A clean break and daily close below that zone would signal that bears are regaining momentum, potentially opening the way for an extension toward or even below the lower Bollinger Band around 2.10. Conversely, if buyers can hold above 2.16 and push through 2.22, attention would likely shift toward the 20-day EMA near 2.33 as the next important test of whether the downtrend is starting to soften.
Future Scenarios and Investment Outlook
Overall, the technical picture for Ripple crypto is currently dominated by a daily bearish regime tempered by signs of intraday stabilization. The alignment of price below the 20, 50, and 200-day EMAs argues that the main scenario remains one of pressure toward lower or sideways prices rather than an immediate bullish reversal. Yet, the moderating MACD momentum and the position of RSI suggest that the most aggressive part of the decline may be behind us, at least for now.
In this context, conservative traders might prefer to wait for clearer evidence of trend change, such as a daily close back above 2.33 combined with improving momentum indicators. More active participants could explore range strategies, buying dips closer to 2.132.16 with tight risk controls and trimming exposure near 2.222.33, respecting the overarching downtrend. As long as market sentiment remains dominated by Extreme Fear and Bitcoin retains high dominance, upside follow-through for XRP is likely to be fragile, and careful position sizing will remain essential.
This analysis is for informational purposes only and does not constitute financial advice.
Readers should conduct their own research before making investment decisions.