The breakdown represents an invalidation of a major demand zone and a transition away from an entrenched bullish pattern toward increased caution and potential extended sell-off. Traders may reconsider their assumptions and shift tactics to sell the bounce rather than buy the dip.
That's because the average had acted as a dynamic floor several times since early 2023, repeatedly holding strong as buyers stepped in around the level, powering a renewed upswing to new lifetime highs.
Looking back at the Strategy precedent, we observed a similar erosion of confidence and an extended sell-off following the breach of the long-held 50-week SMA. CoinDesk previously noted the bearish development in Strategy’s 50-week SMA breach, cautioning that Bitcoin could face a similar move.
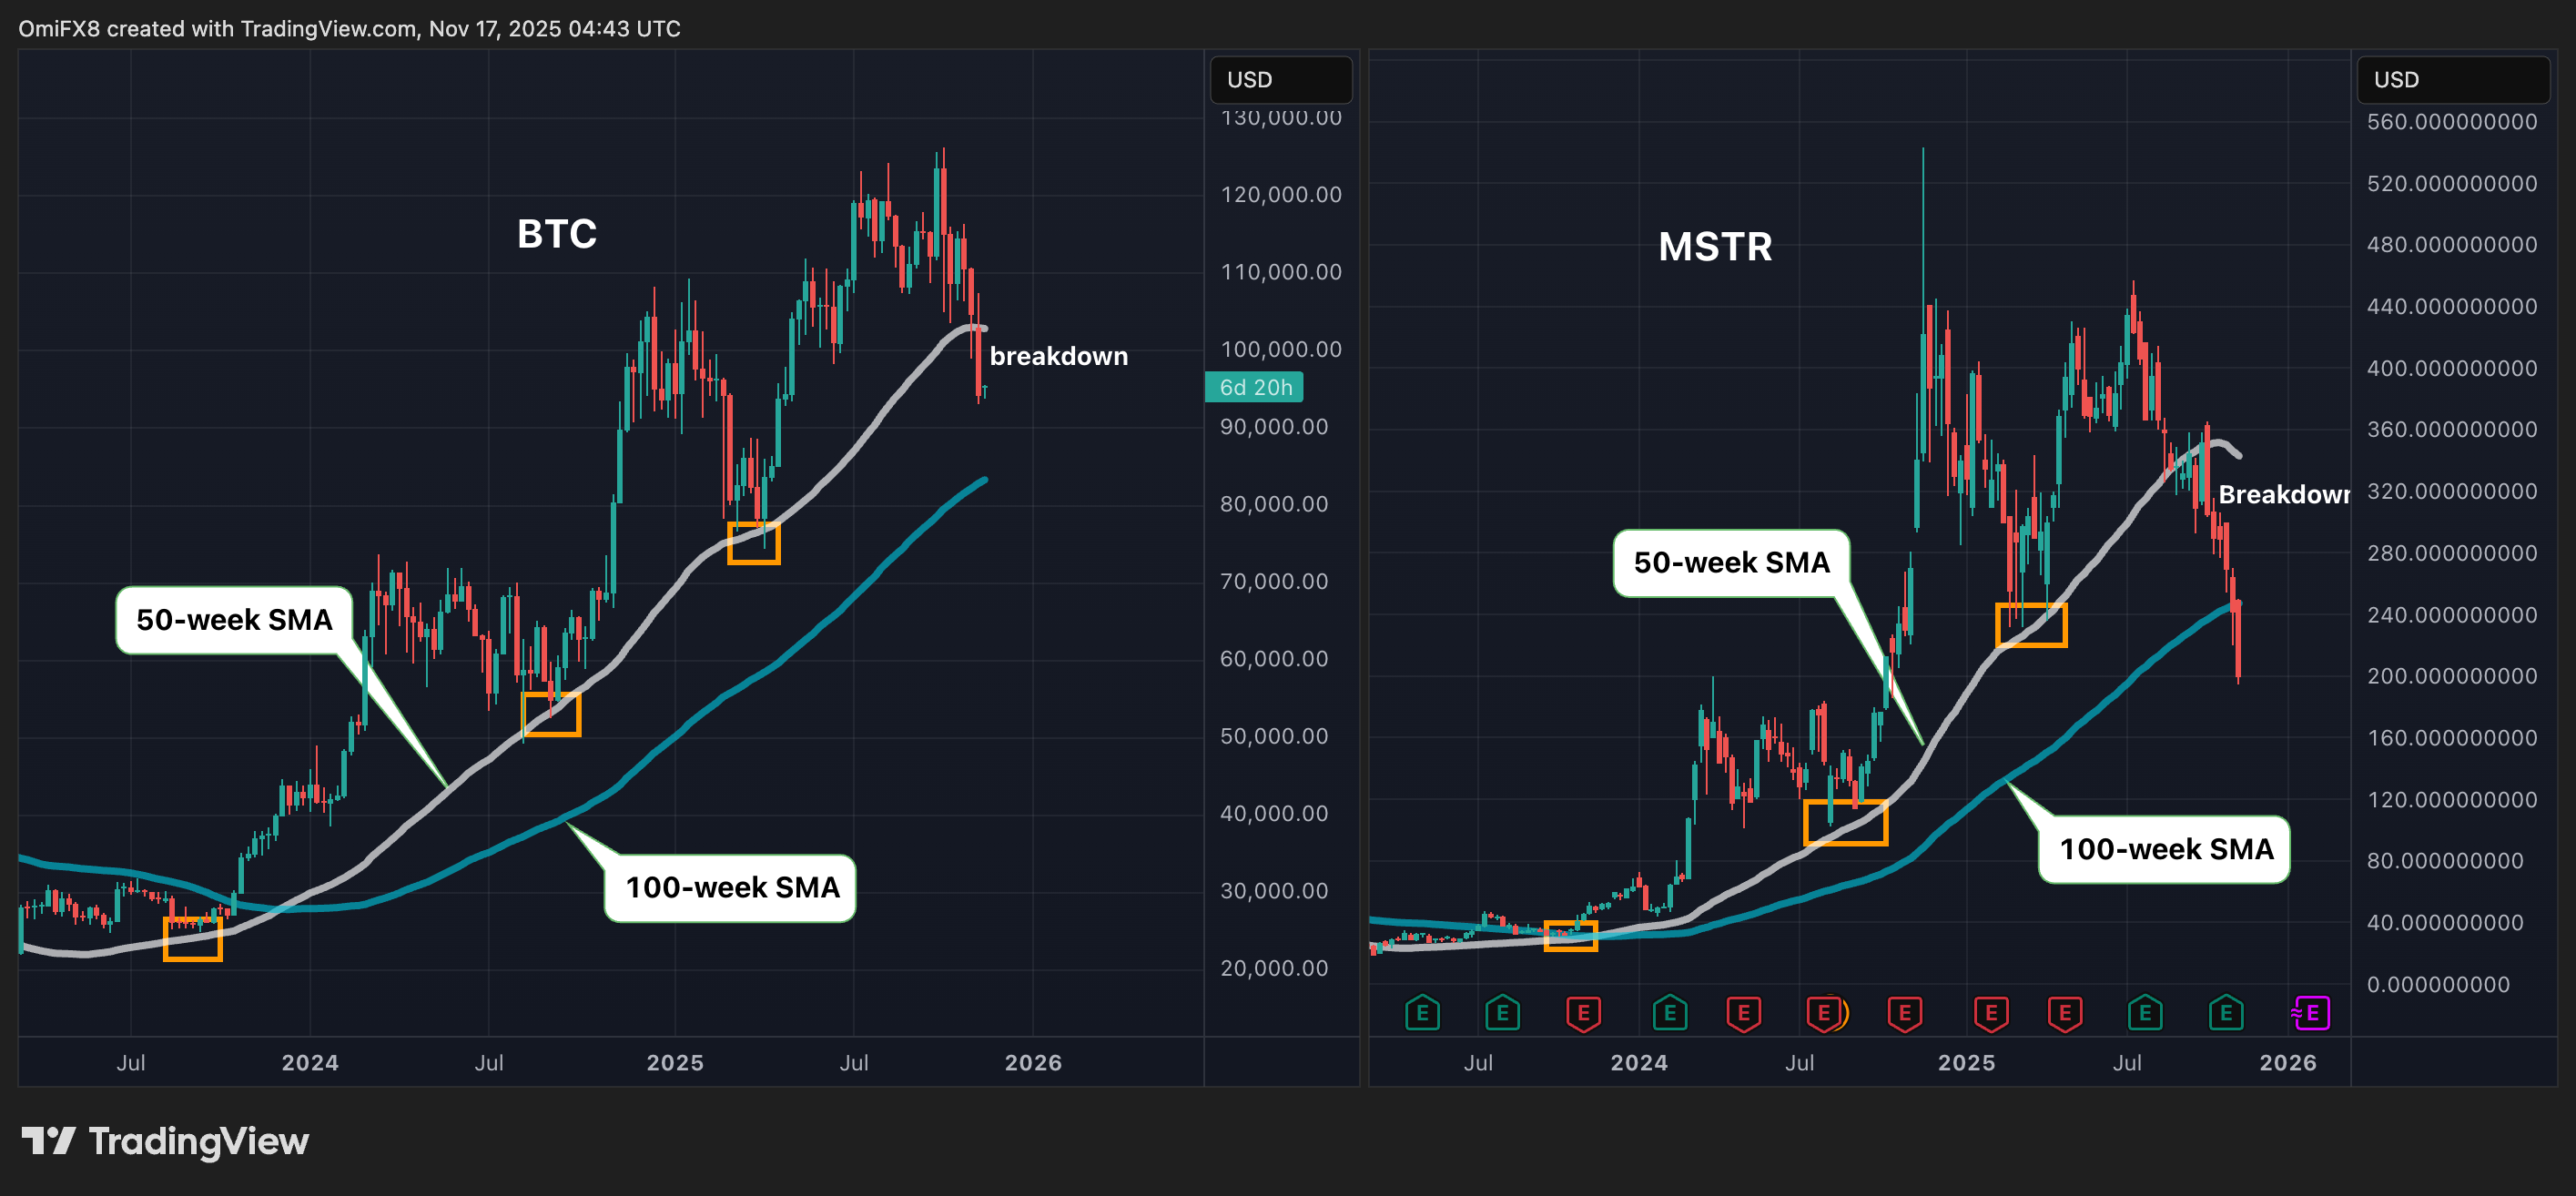
$BTC vs MSTR (TradingView)
The former support at the 50-week simple moving average has now turned into resistance, meaning any bounce will likely face selling pressure near $102,868. Sustained weekly closes above this level would be needed to signal a renewed bullish trend.
MSTR, the largest publicly-listed $BTC holding firm, fell below its 50-week SMA in September nad has since extended the sell-off to $200, the lowest since October 2024.

 coindesk.com