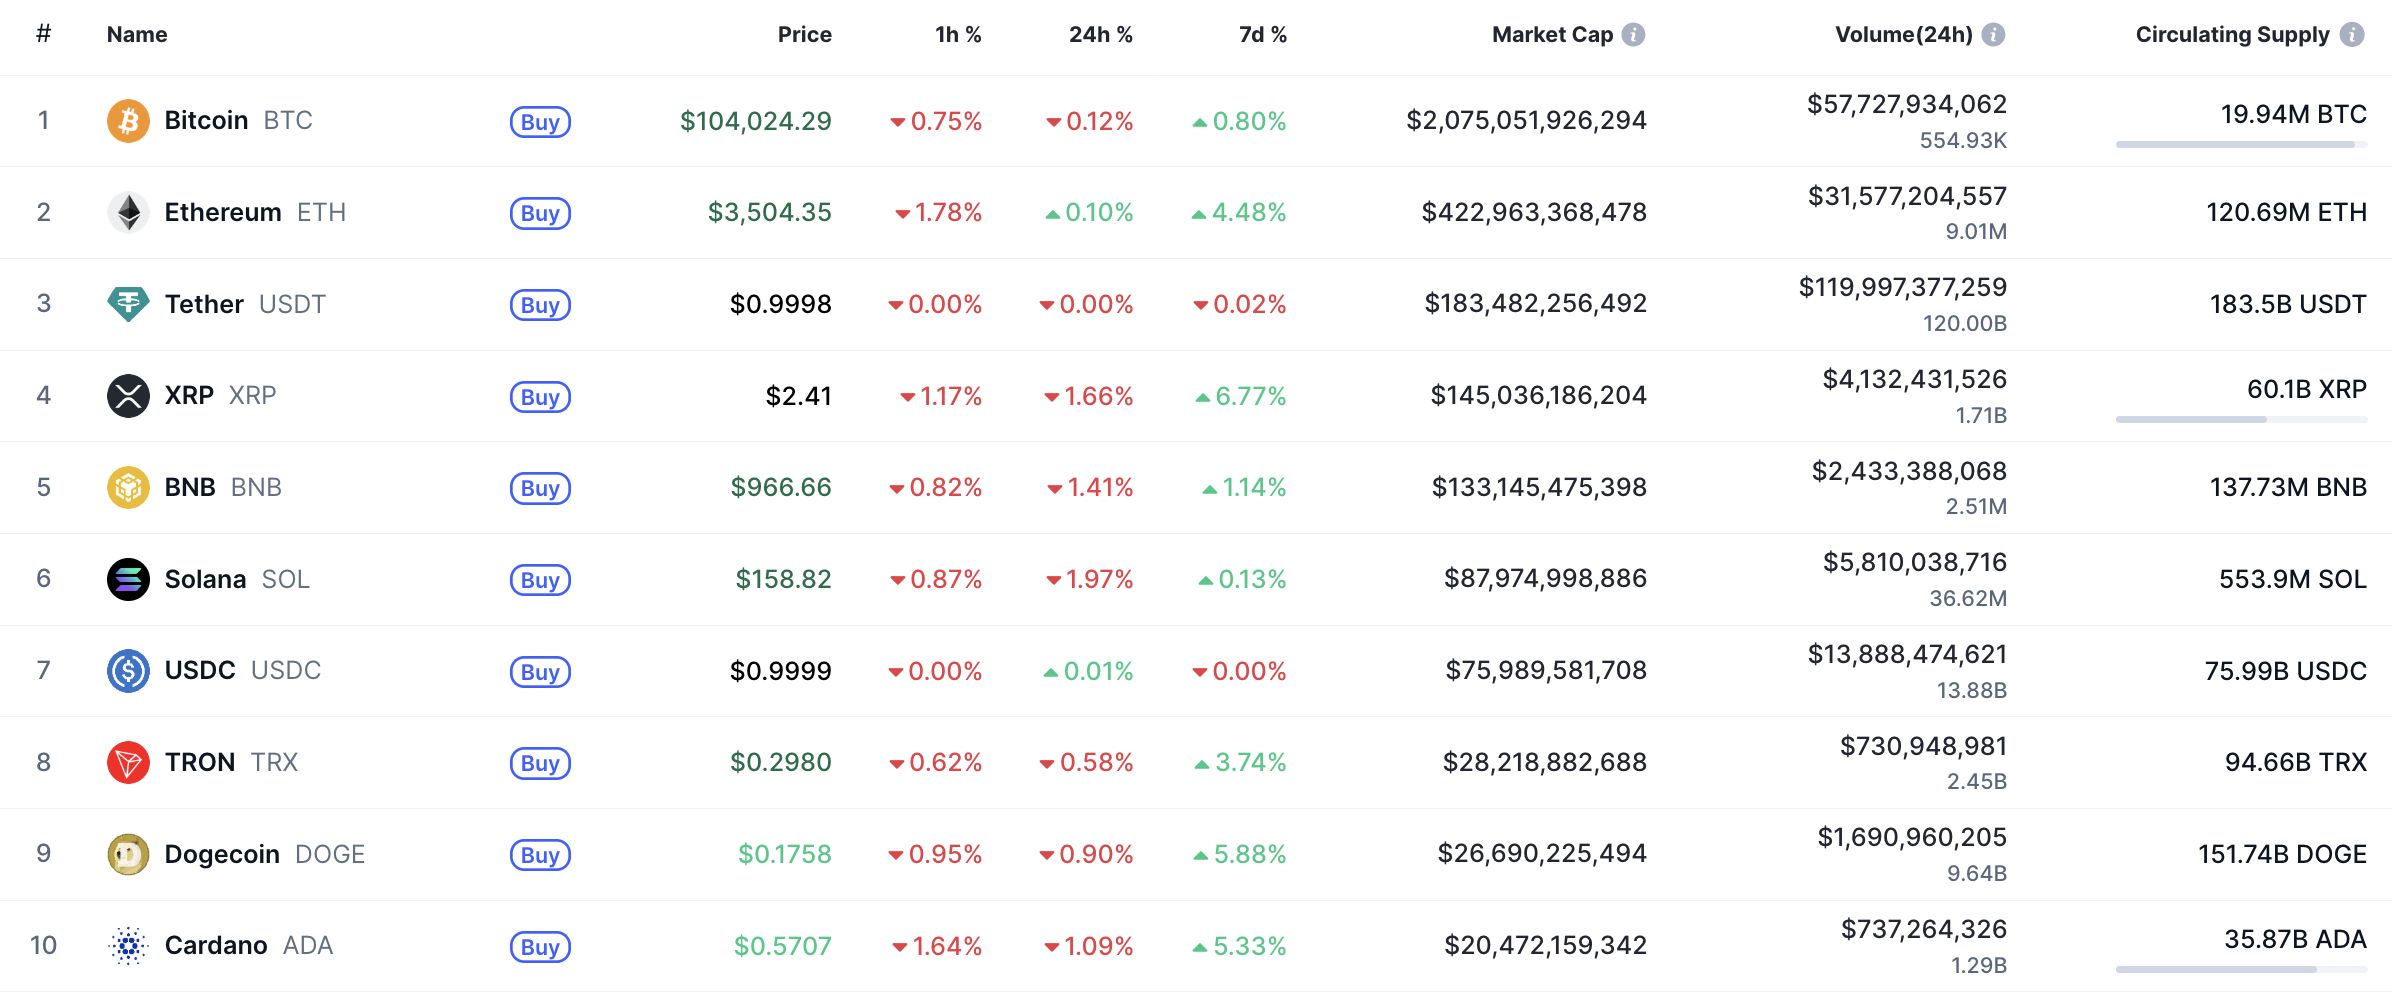
The market is mainly in the red zone today, according to CoinMarketCap.
$SOL/USD
The rate of Solana ($SOL) has declined by almost 2% over the last 24 hours.
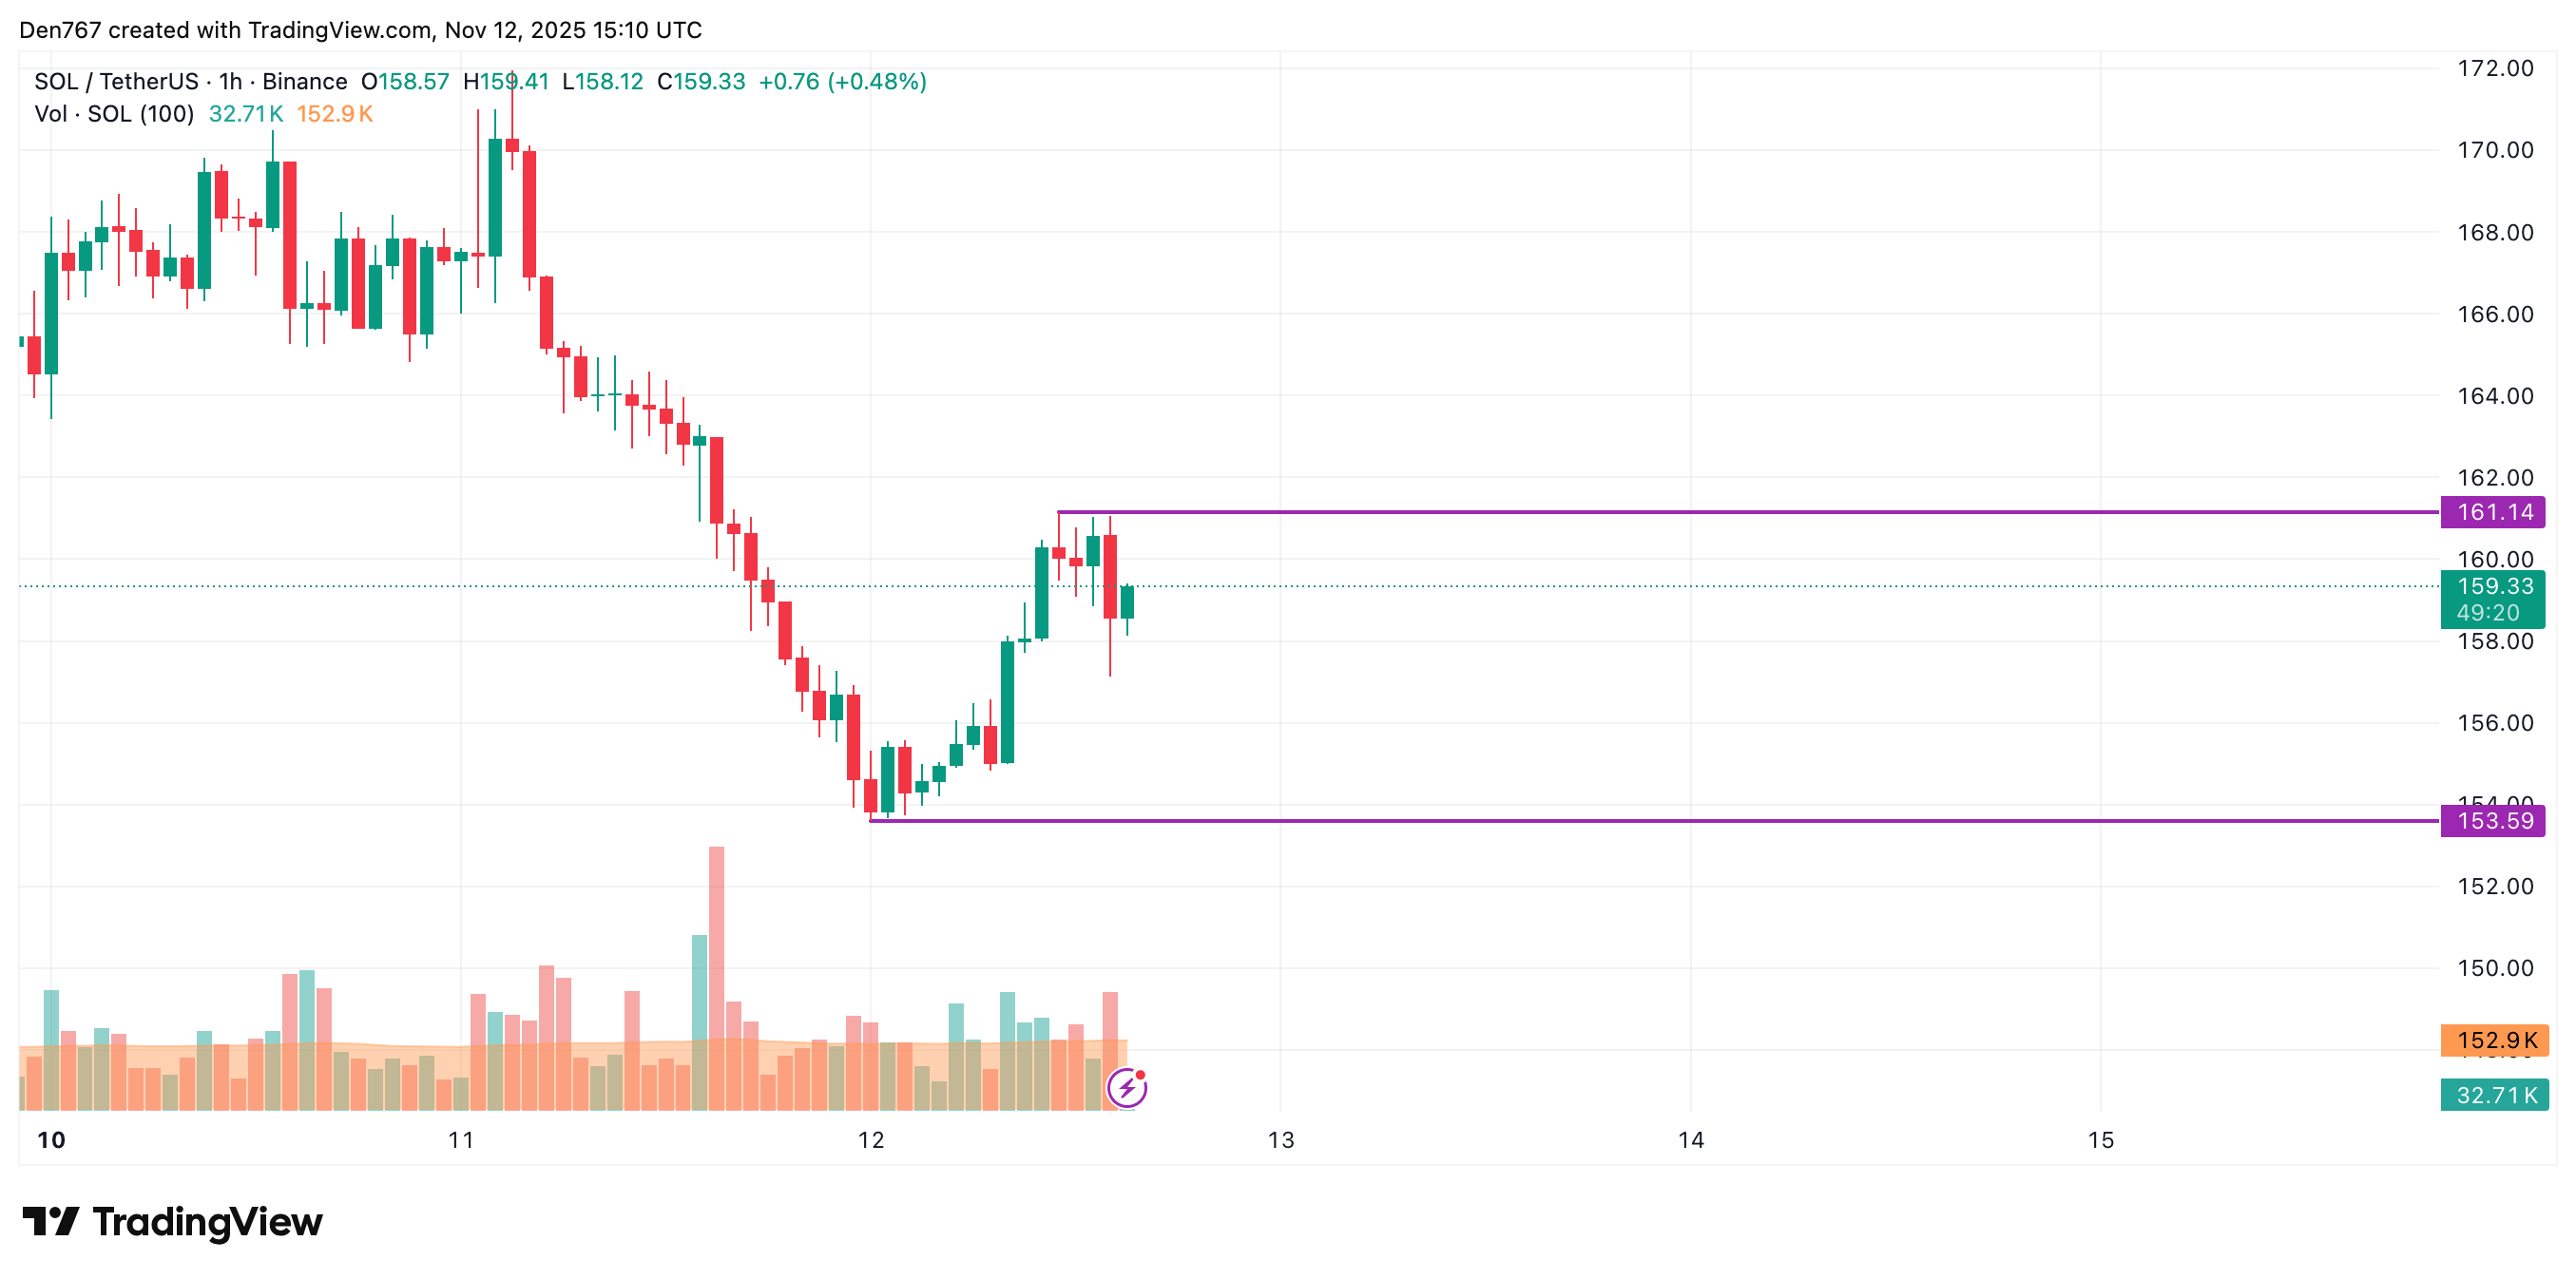
On the hourly chart, the price of $SOL has set a local resistance of $161.14. However, if the daily bar closes around that mark or above it, growth may continue to the $165 area until tomorrow.
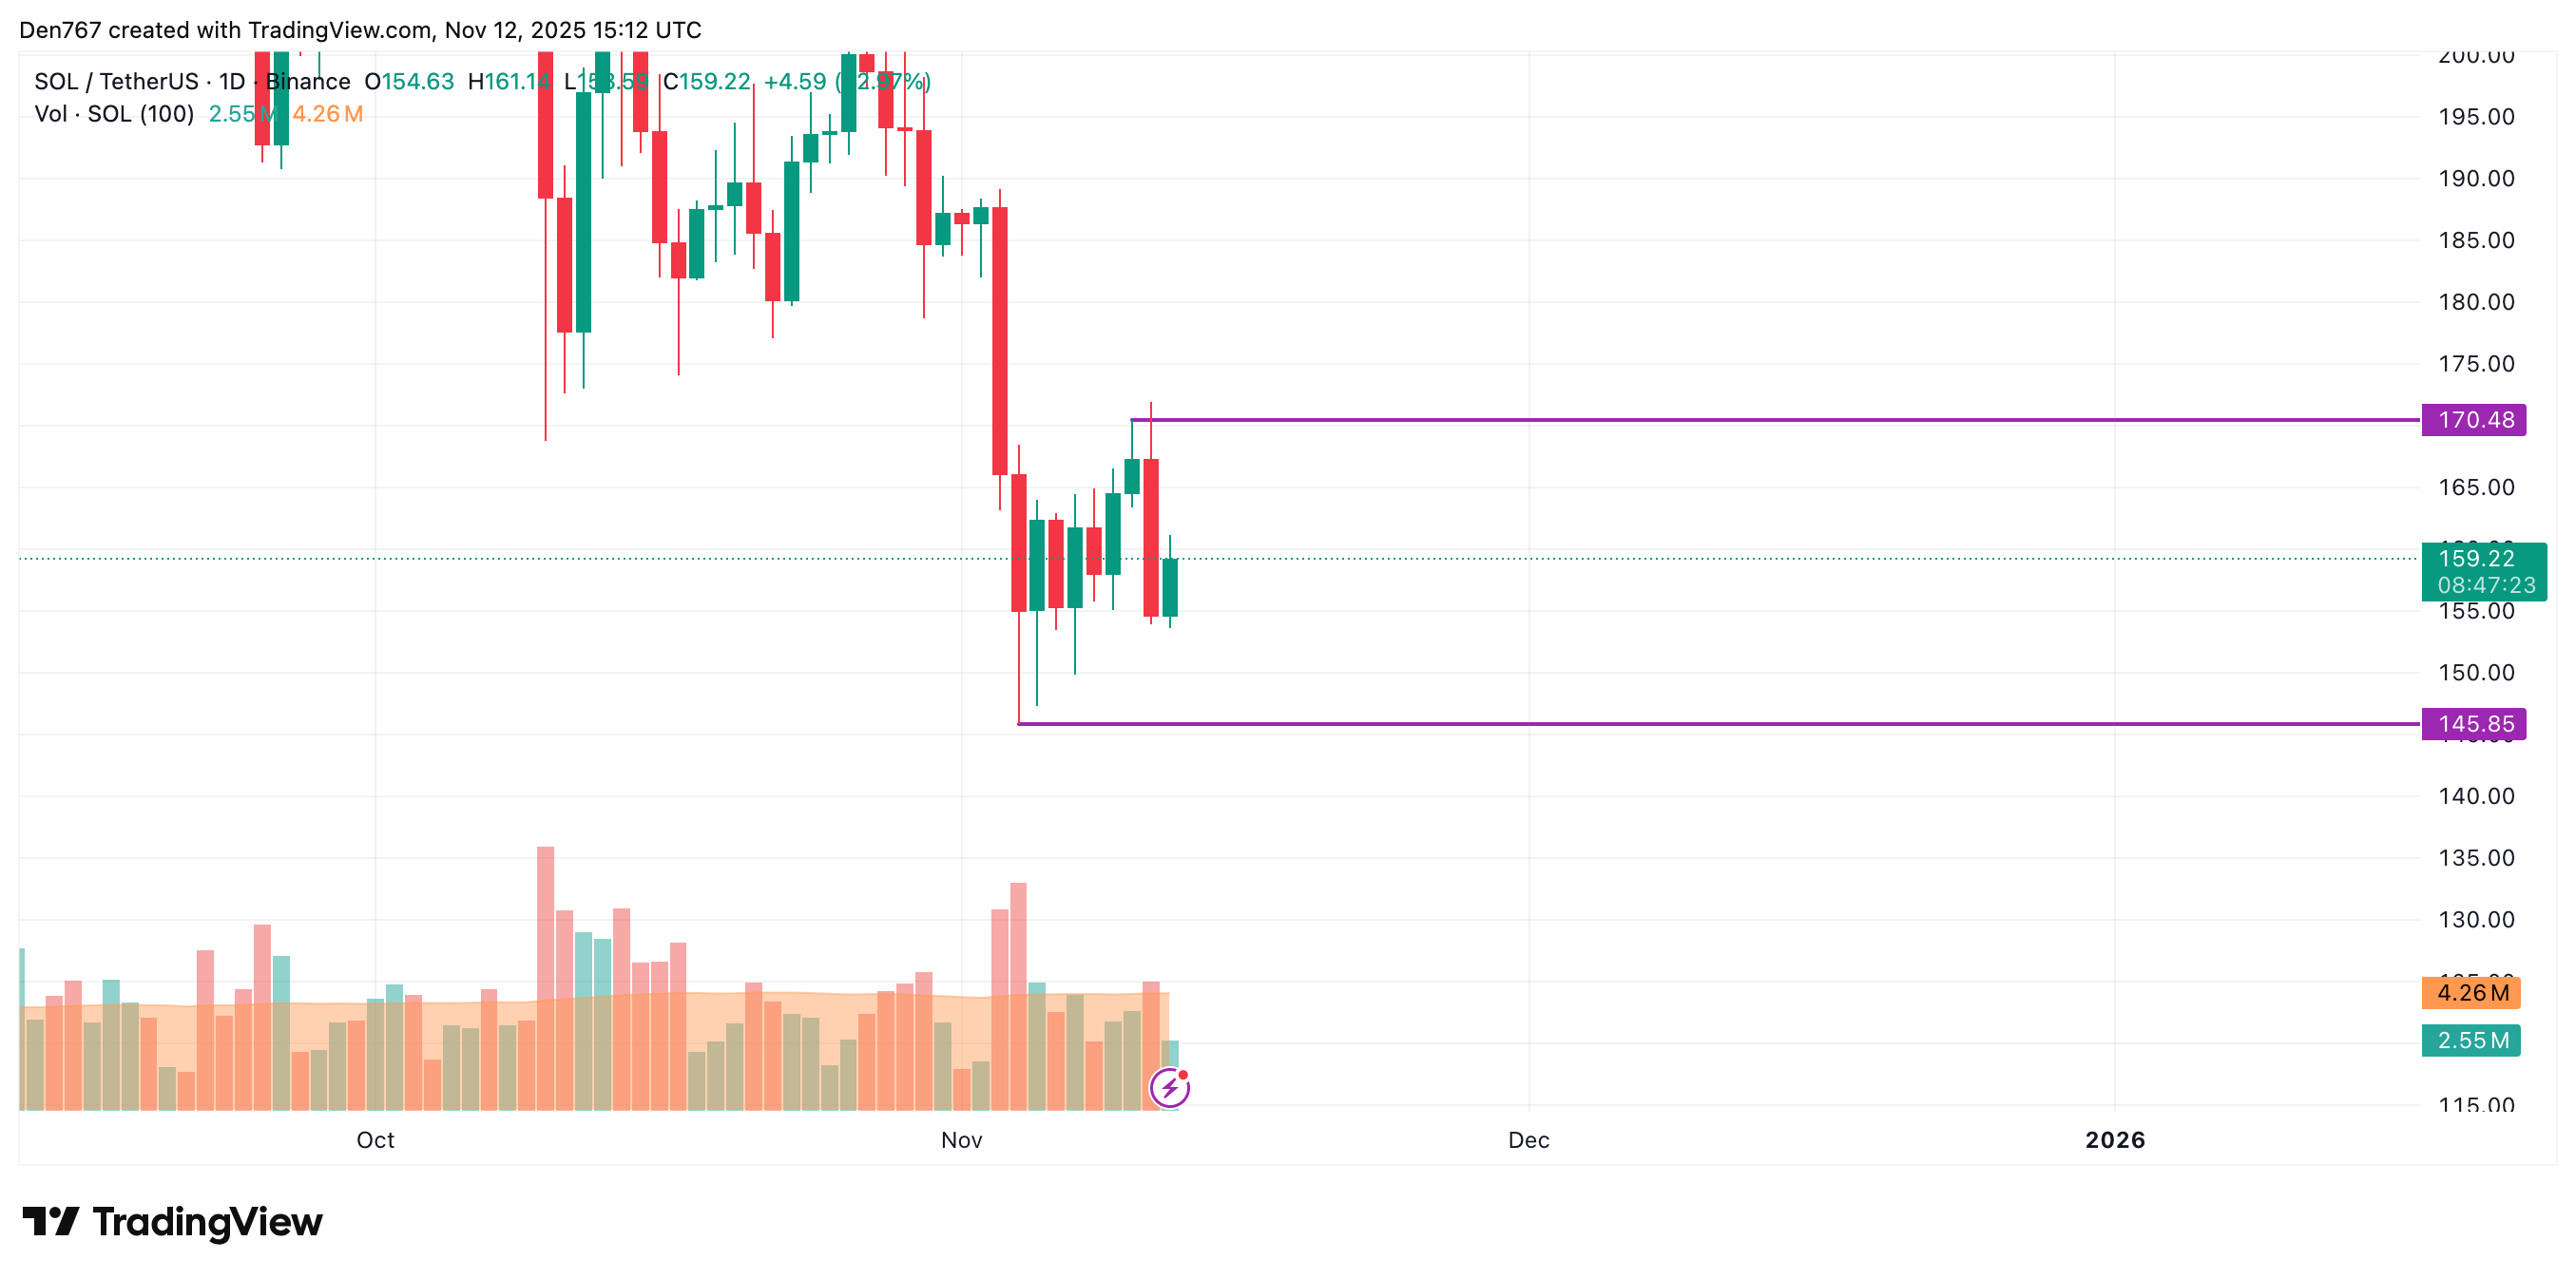
On the longer time frame, the situation is less bullish. The rate of $SOL is far from the key level, which means none of the sides is ready for a sharp move.
Thus, the volume is low, confirming the absence of buyers and sellers' energy. All in all, sideways trading in the range of $155-$165 is the most likely scenario.
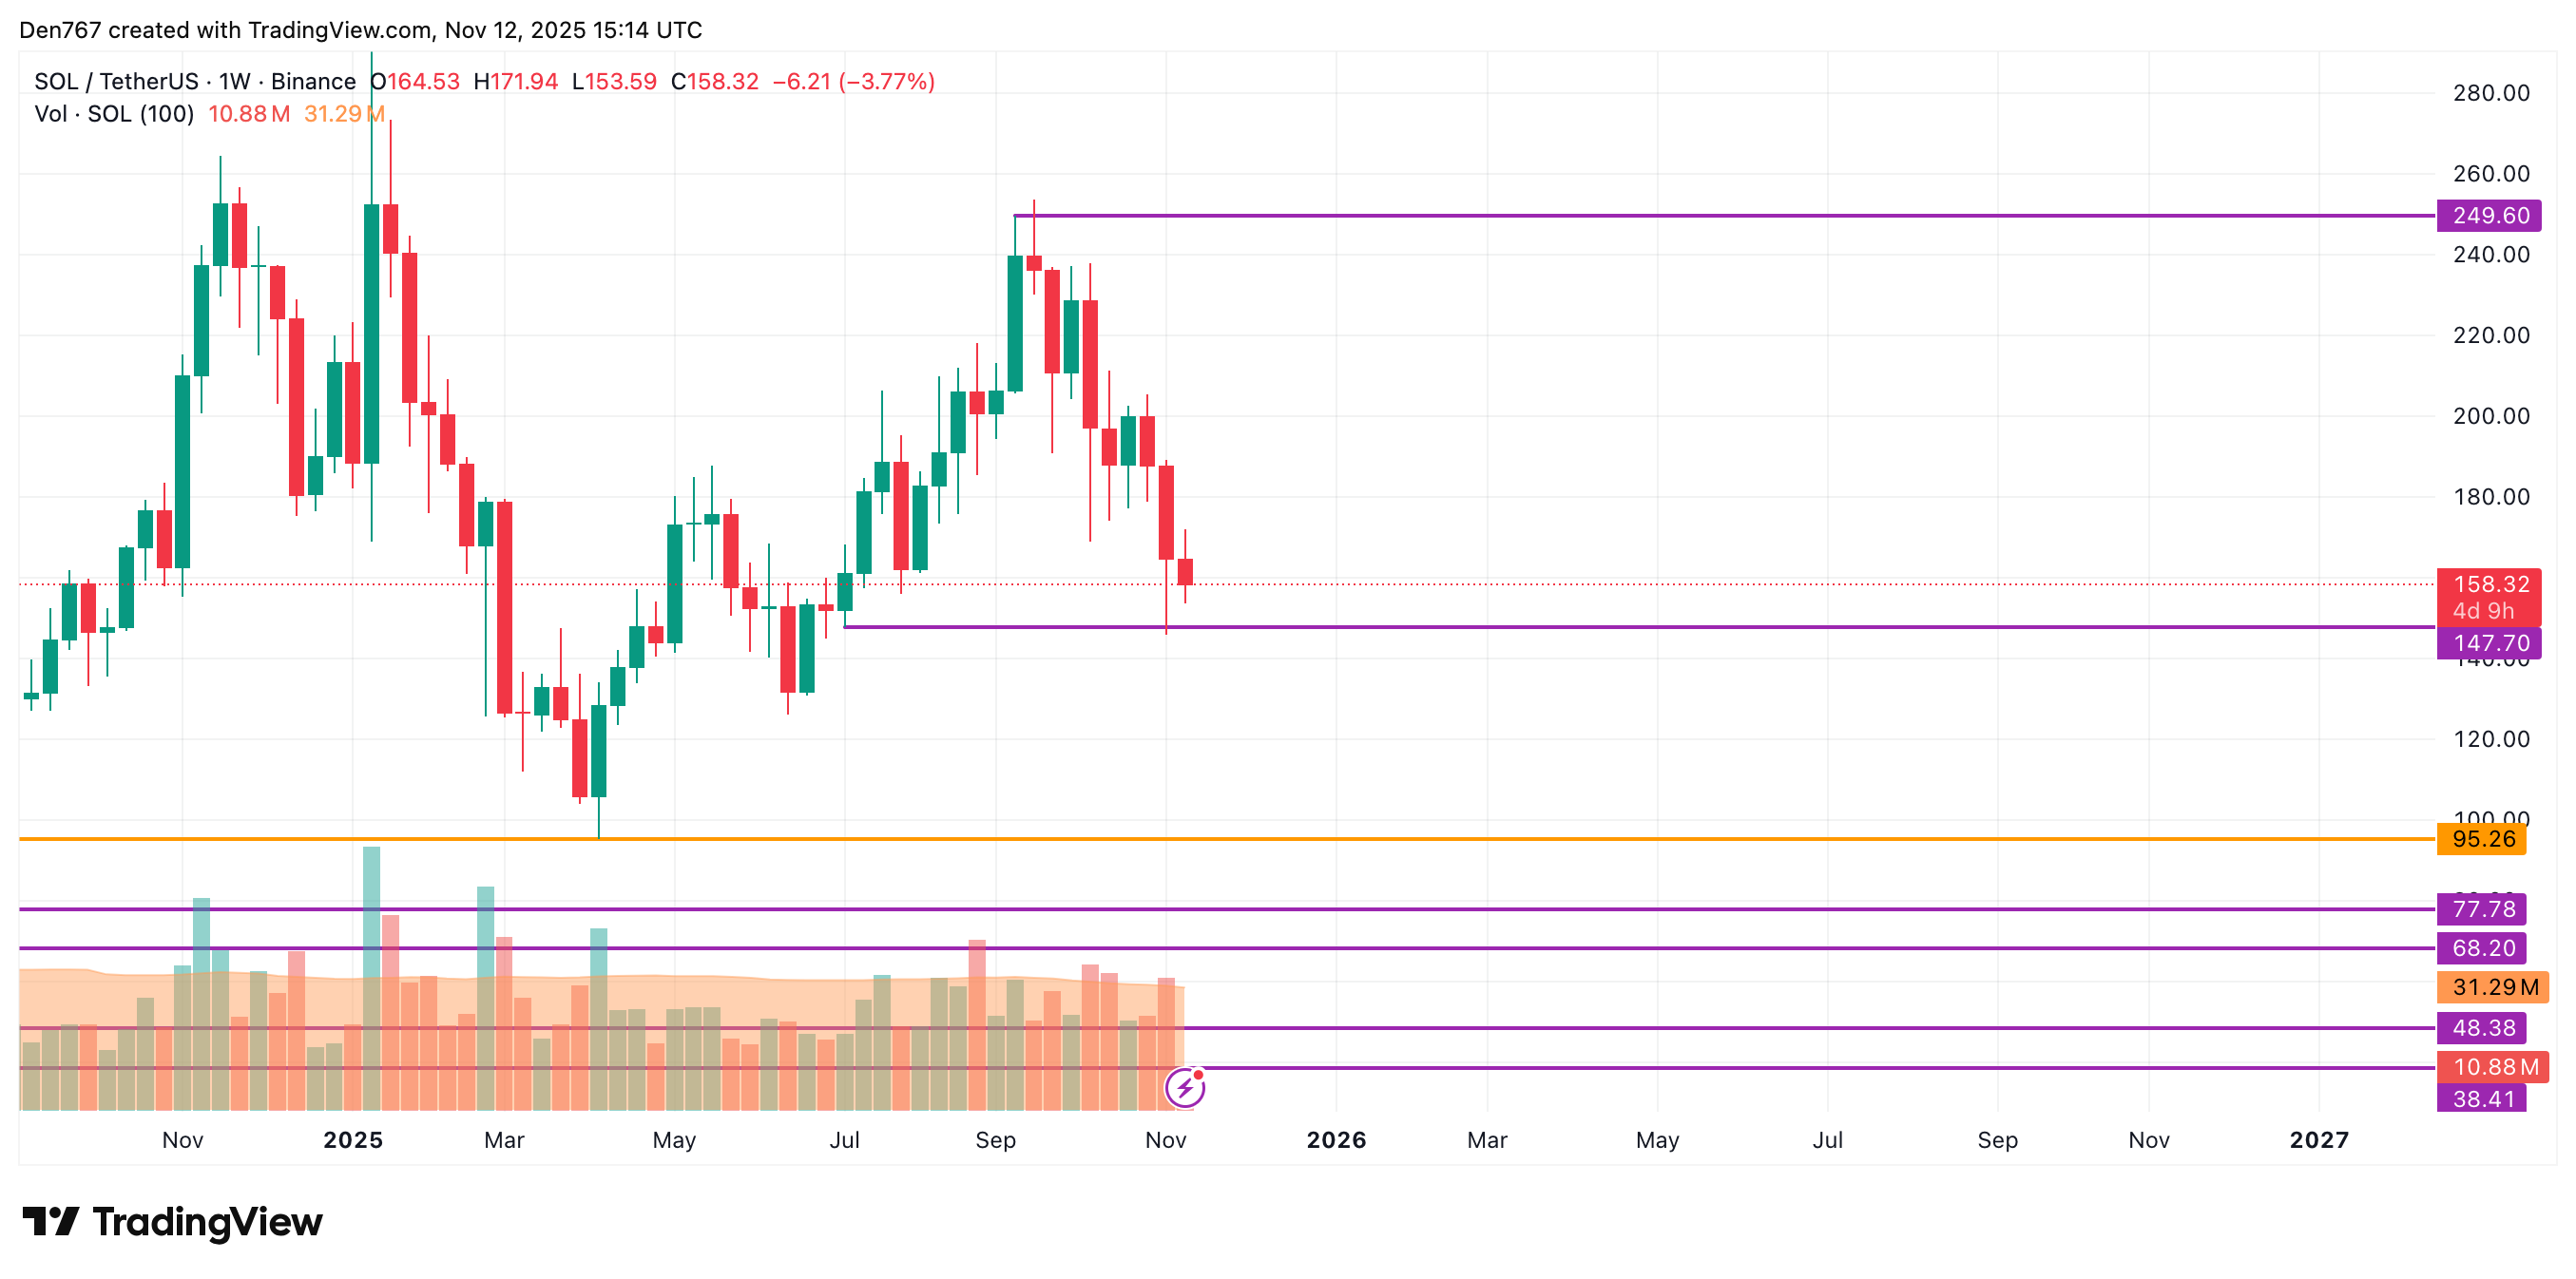
From the midterm point of view, the picture is bearish. If the weekly bar breaks the $147 support, the accumulated energy might be enough for a test of the $130-$140 area.
$SOL is trading at $158.32 at press time.