
Pepe (PEPE) has broken below a key neckline support, completing a textbook head-and-shoulders pattern. The move suggests further downside risk.
Meanwhile, the price is around $0.00000558 at press time, with a weekly drop of over 17%.
Pattern Structure and Target Projections
The chart posted by Ali Martinez shows a well-defined head and shoulders formation. The neckline support broke at approximately $0.0000065, triggering a bearish move. This structure is typically known for reversing uptrends when confirmed by a neckline break.
$PEPE is breaking out of a head and shoulders pattern, targeting $0.00000185. https://t.co/3unebL2w7X pic.twitter.com/cG8378JKFY
— Ali (@ali_charts) November 6, 2025
The projected target from this breakdown points toward $0.00000185. This is based on the measured move from the top of the head to the neckline and confirmed with Fibonacci levels. The chart shows possible support at $0.00000490 and $0.00000333 before reaching lower targets.
Price and Volume Trends
PEPE’s price continues to trade below its 9-day EMA. This keeps momentum tilted to the downside. The recent decline in volume adds to this view. Daily trading volume is now near $310 million, a drop of more than 50% compared to the previous day.
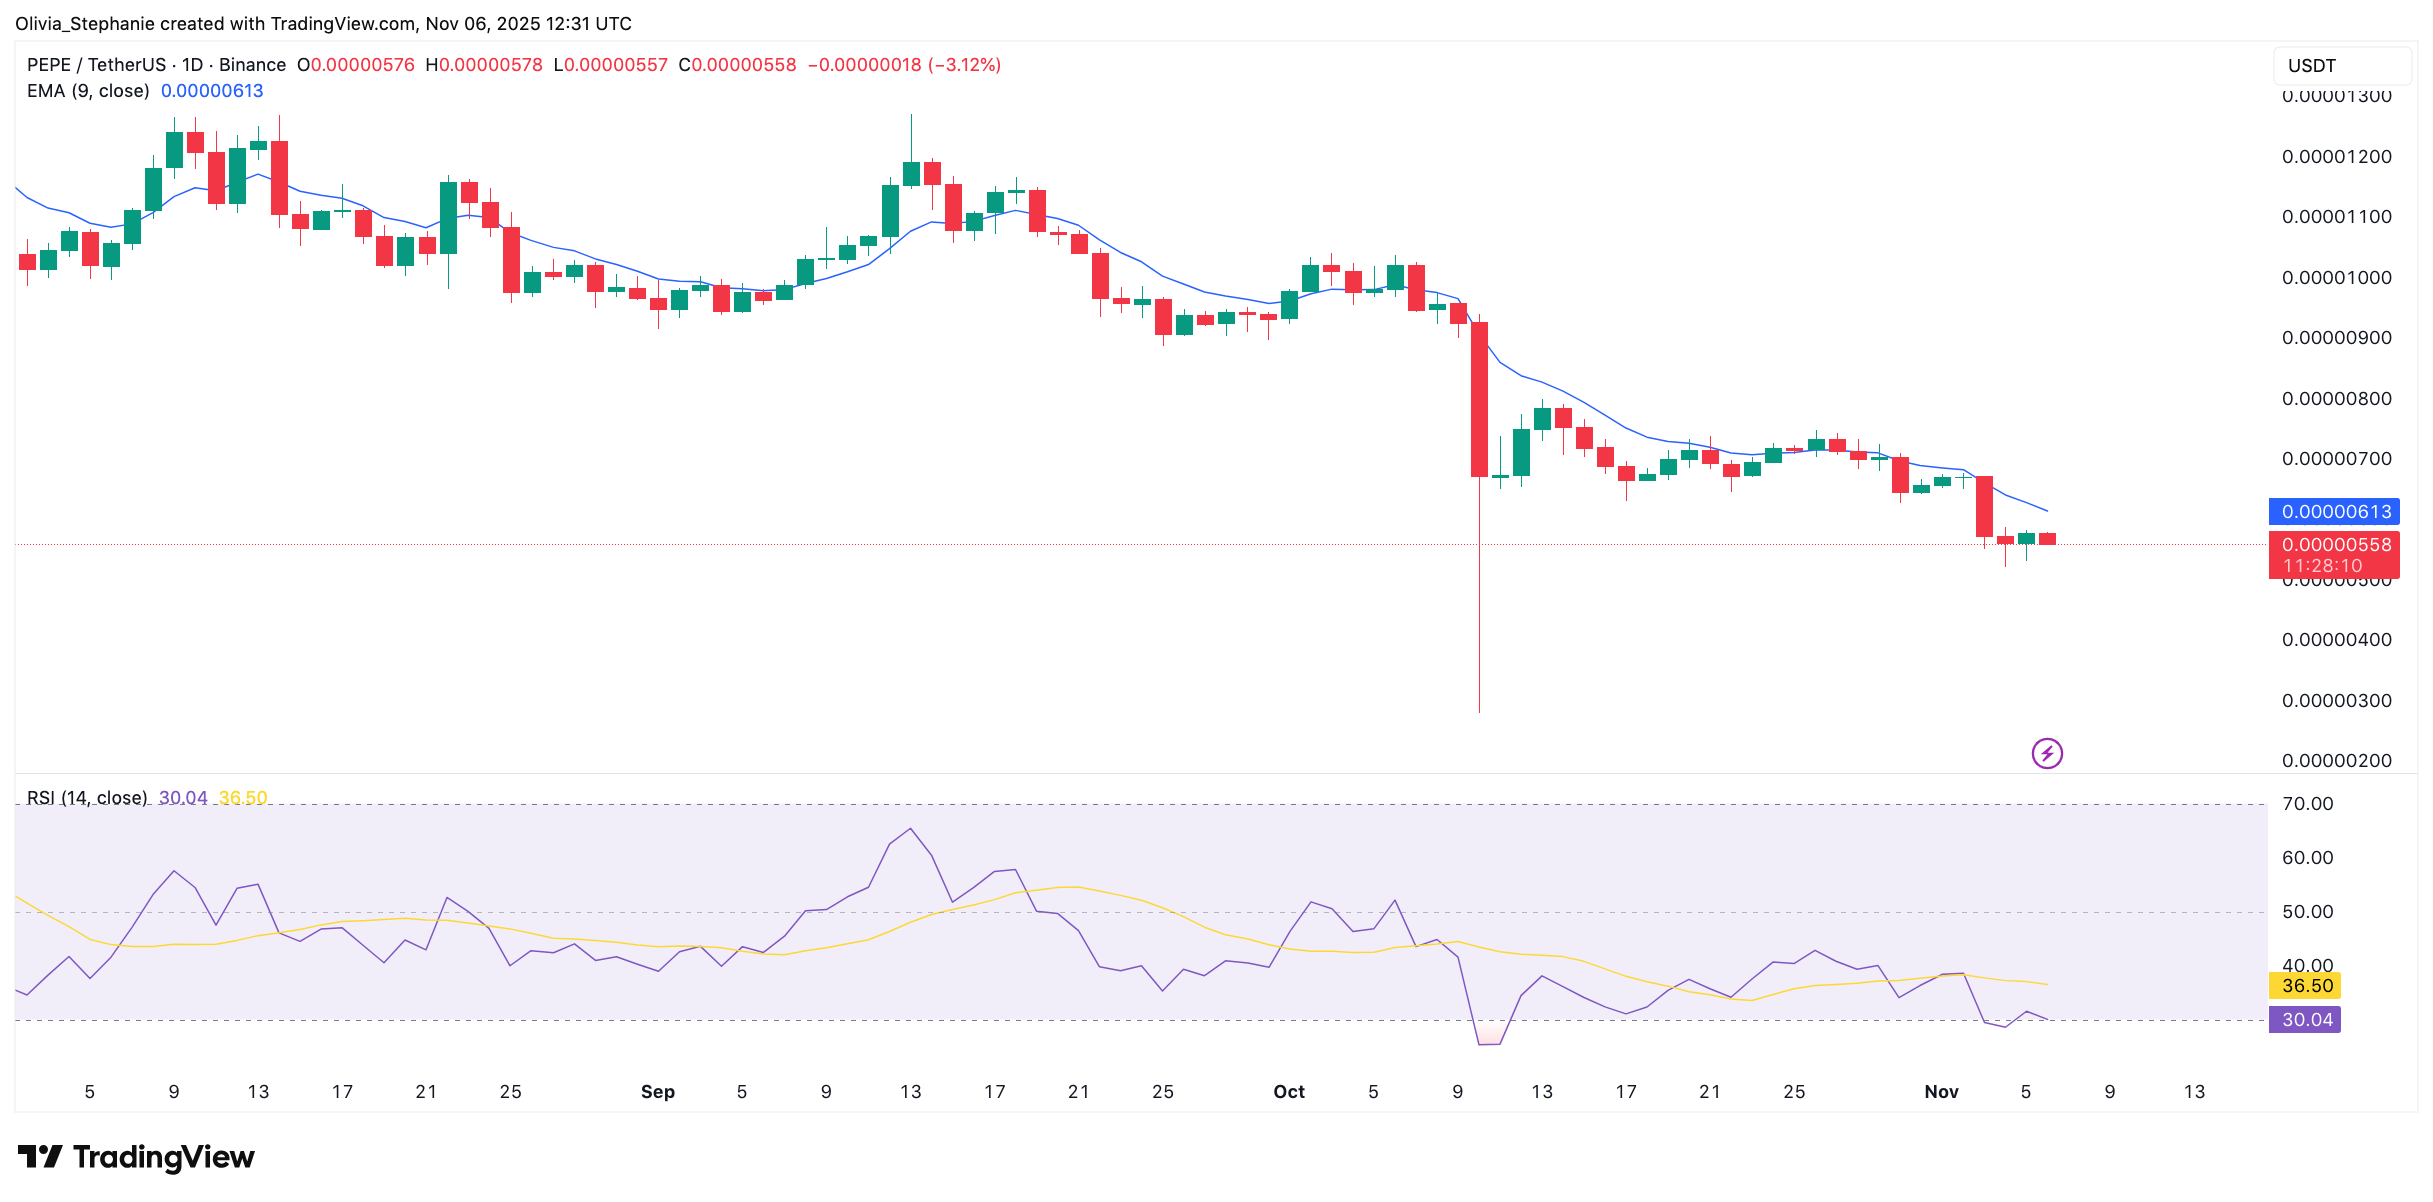
On the RSI, the reading sits at 30. This level is near oversold territory but has not yet triggered a reversal. Unless volume returns or buyers step in, the trend may remain weak in the near term.
You may also like:
- James Wynn’s Painful Comeback: Reopens PEPE Long, Faces Another Brutal Liquidation
- Did a Whale Just Signal a PEPE Bull Run? On-Chain Data Suggests It’s Happening
- Crypto Whale Wynn Quits After Scoring $25M from $1.25B Bitcoin Bet
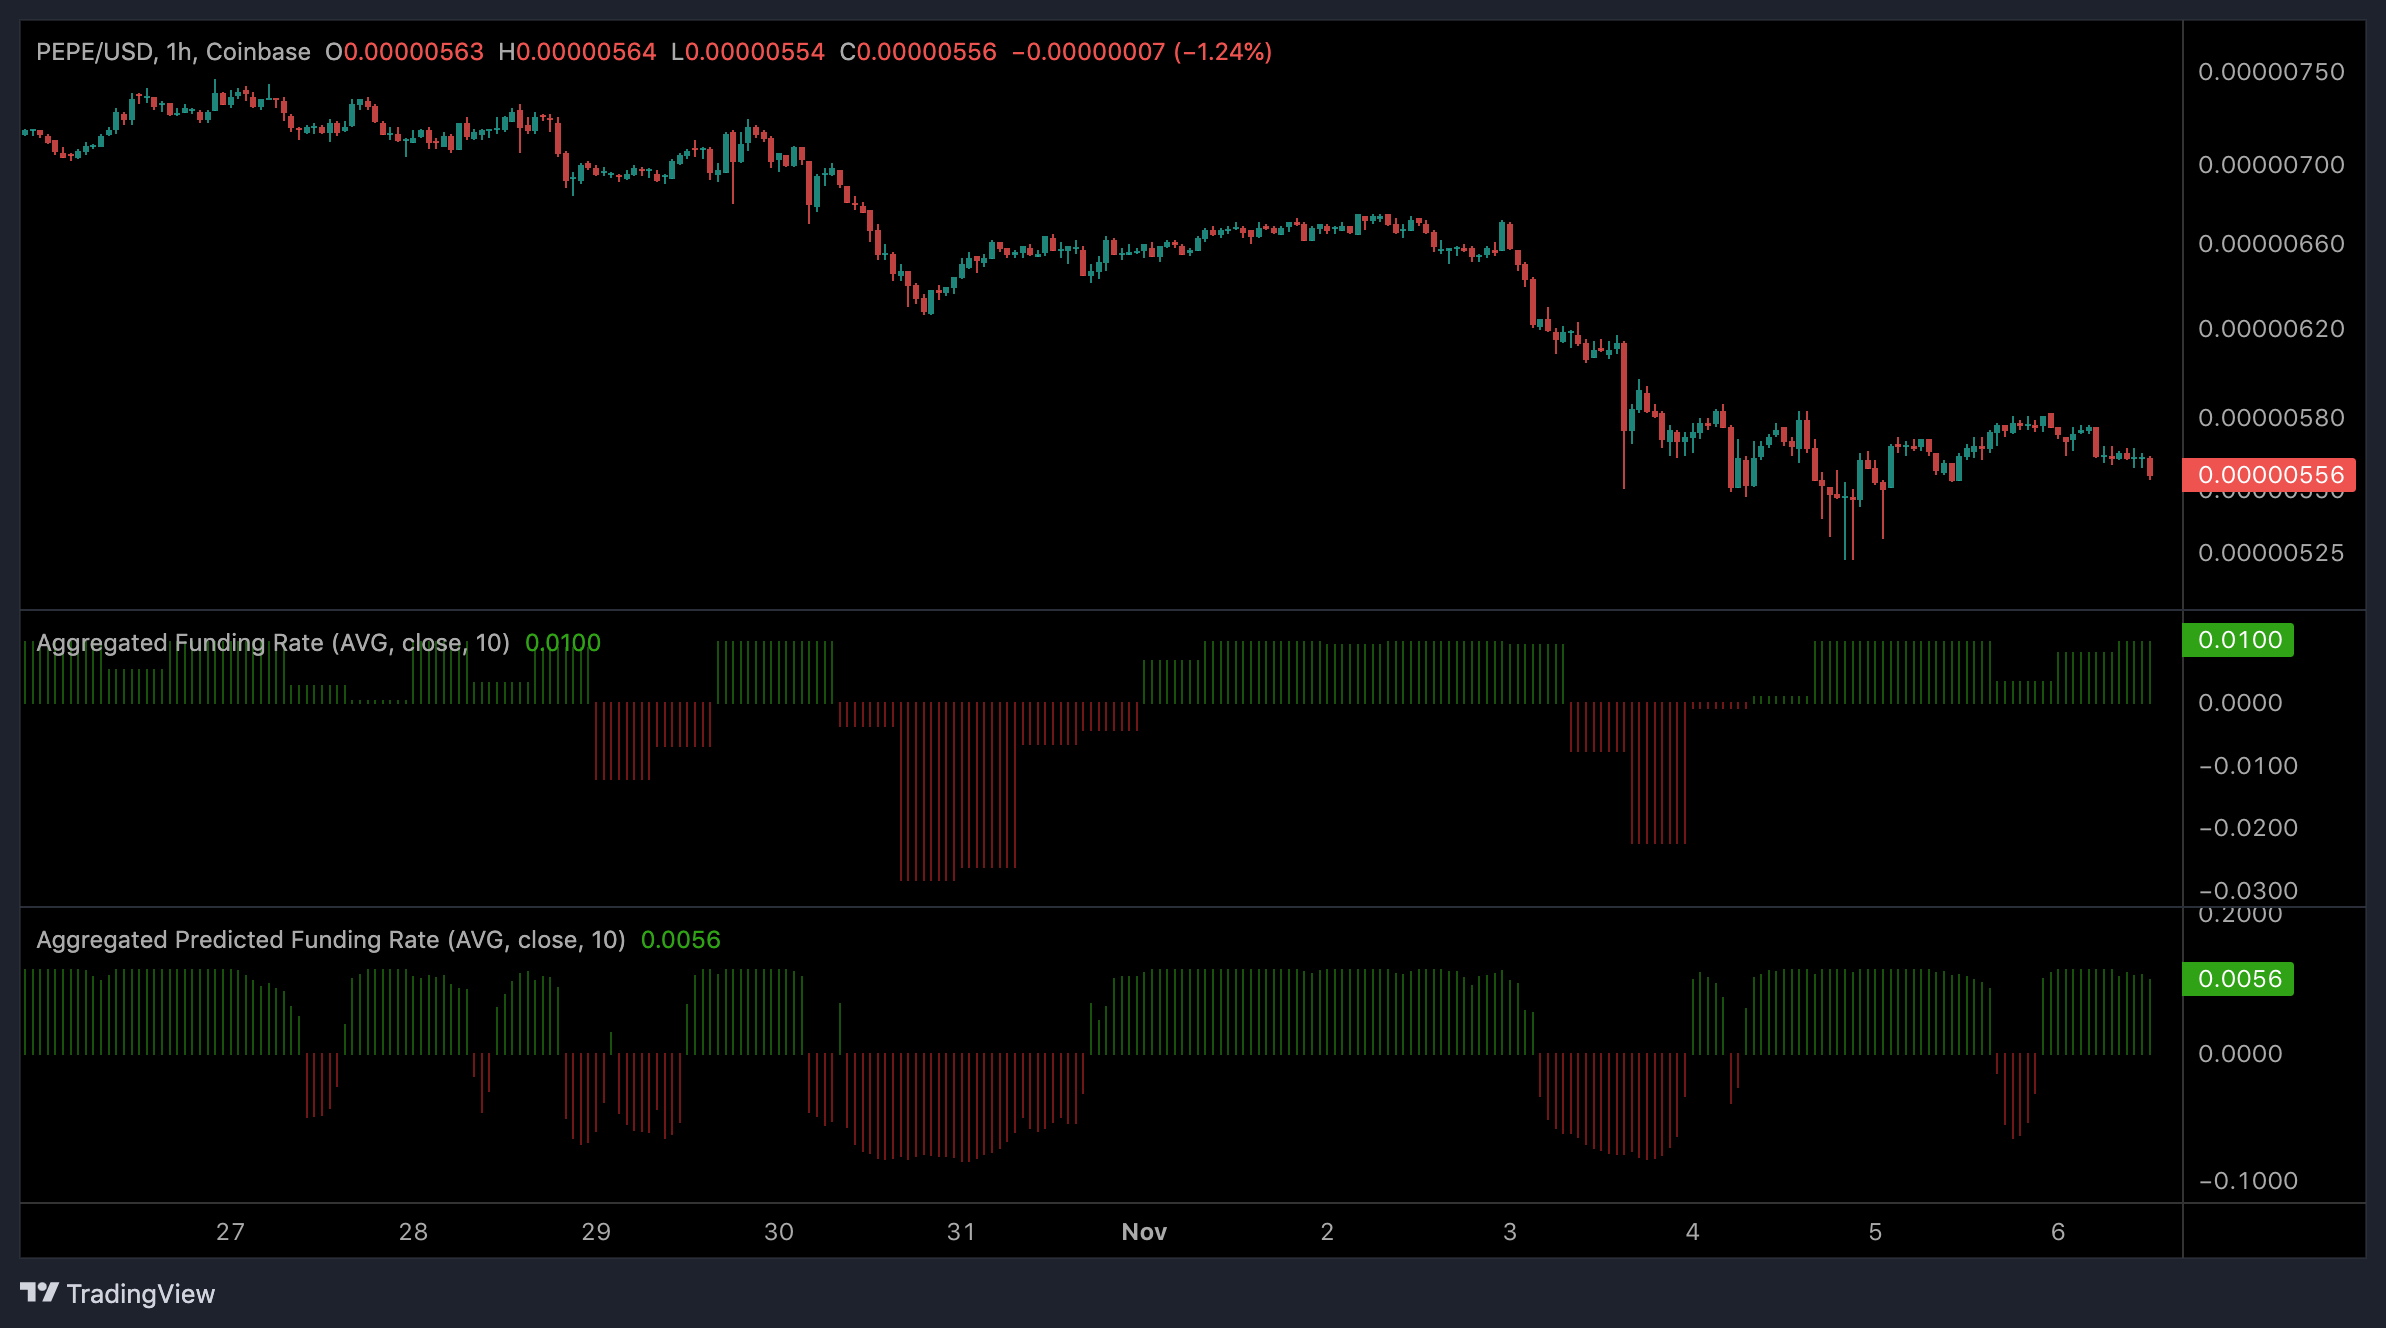
Funding Rates Turning Positive
Data from Coinalyze shows the aggregated funding rate is now +0.0100. The predicted rate is +0.0056. Both metrics have flipped from negative to positive, suggesting some traders are positioning for a bounce. These figures often indicate a shift in sentiment, especially after a strong drop.
However, the price remains below resistance. Until levels above $0.0000065 are reclaimed, the pattern’s structure remains in play.
The current structure suggests sellers remain in control. Until the asset builds above key resistance, the next move toward the $0.00000185 target remains on the table.