$XRP’s Historical Price Trend
For context, after reaching the $0.0614 $ATH resistance in December 2013, $XRP collapsed considerably in the following months. Interestingly, when it recovered, the initial attempt to reclaim the December 2013 $ATH failed, with $XRP facing a lower resistance point at $0.0280 by December 2014. Ether Nasyonal’s chart identified this as a new demand zone.
Following the $0.0280 resistance at this demand zone, $XRP collapsed again and continued to underperform for over two years. However, by March 2017, the token recovered and eventually overcame the demand zone at the December 2014 resistance of $0.0280. From here, it soared again to the higher December 2013 $ATH resistance of $0.0614.
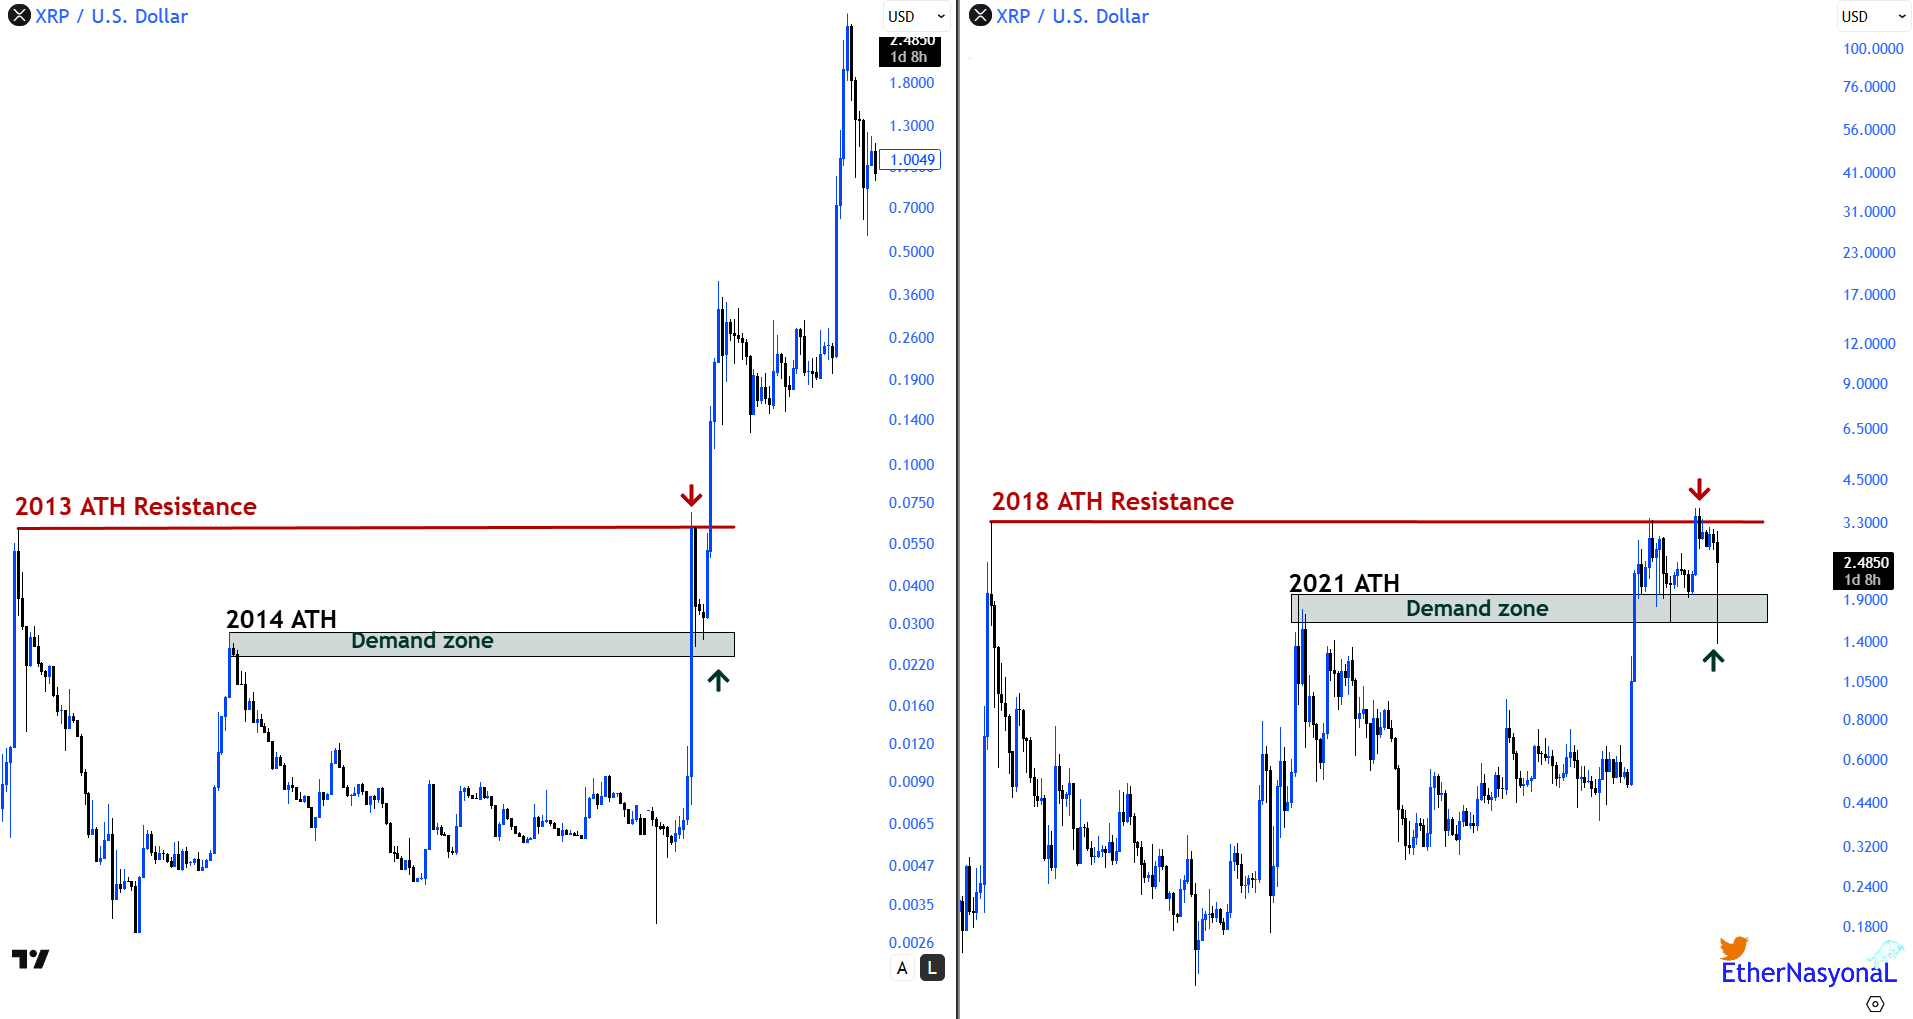
$XRP Historical Trend Ether Nasyonal">
$XRP Historical Trend | Ether Nasyonal
After this, $XRP pulled back to again retest the demand zone at $0.0280 before rebounding to finally surpass the $0.0614 peak. This allowed the token to reach a new all-time high of around $3.3 by January 2018.
A Repeat of the Pattern
Nonetheless, as was the case in December 2013, $XRP corrected after the $3.3 $ATH resistance. During the 2021 bull run, it again targeted the $3.3 peak, but failed to claim it. Instead, it faced a lower resistance at $1.9 in April 2021 before correcting for years. This formed a new demand zone.
When $XRP recovered in November 2024, it overcame this demand zone at $1.9, soaring to hit the 2018 $ATH resistance at $3.3 by January 2025. $XRP has been flirting with this resistance throughout this year, occasionally dipping back to the demand zone at $1.9. This same pattern occurred in early 2017 before the explosive surge.
Now that $XRP has again retested the demand zone, Ether Nasyonal believes it could trigger a run similar to the 2017 rally. However, the analyst failed to present any price targets for this imminent upsurge. Despite this, analysts such as EGRAG Crypto have suggested that $XRP has the potential to reach $27.

 thecryptobasic.com