cryptopotato.com
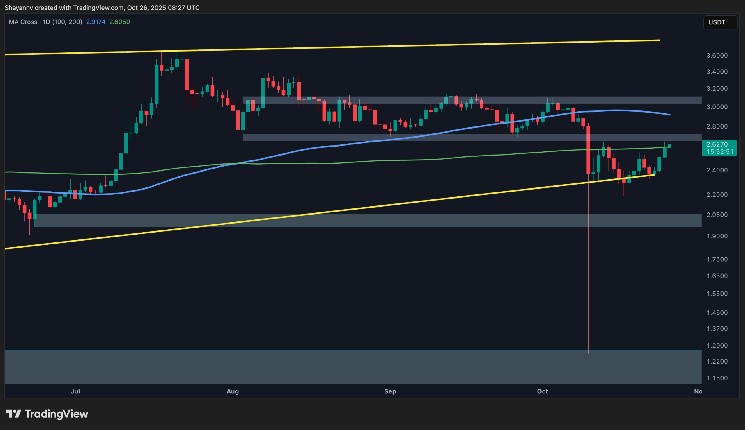
Ripple’s $XRP has managed to slightly break above the 200-day moving average (MA) at $2.6, marking an early bullish signal. However, with significant supply zones directly ahead, the probability of an extended consolidation phase remains high until a decisive move confirms trend continuation.
Ripple Price Analysis
By Shayan
The Daily Chart
On the daily timeframe, $XRP has attracted notable buying interest from the lower boundary of its multi-month ascending wedge, initiating a recovery phase. The asset has now reached and slightly surpassed the 200-day MA at $2.6, a key technical milestone that suggests a potential shift in sentiment — provided it can hold above this level.
However, the $2.7 supply zone sits just above the moving average, representing a critical obstacle that could reject further upward momentum and maintain price compression within the broader wedge. Therefore, $XRP’s behavior around this confluence zone will be pivotal in defining the next directional trend.
The 4-Hour Chart
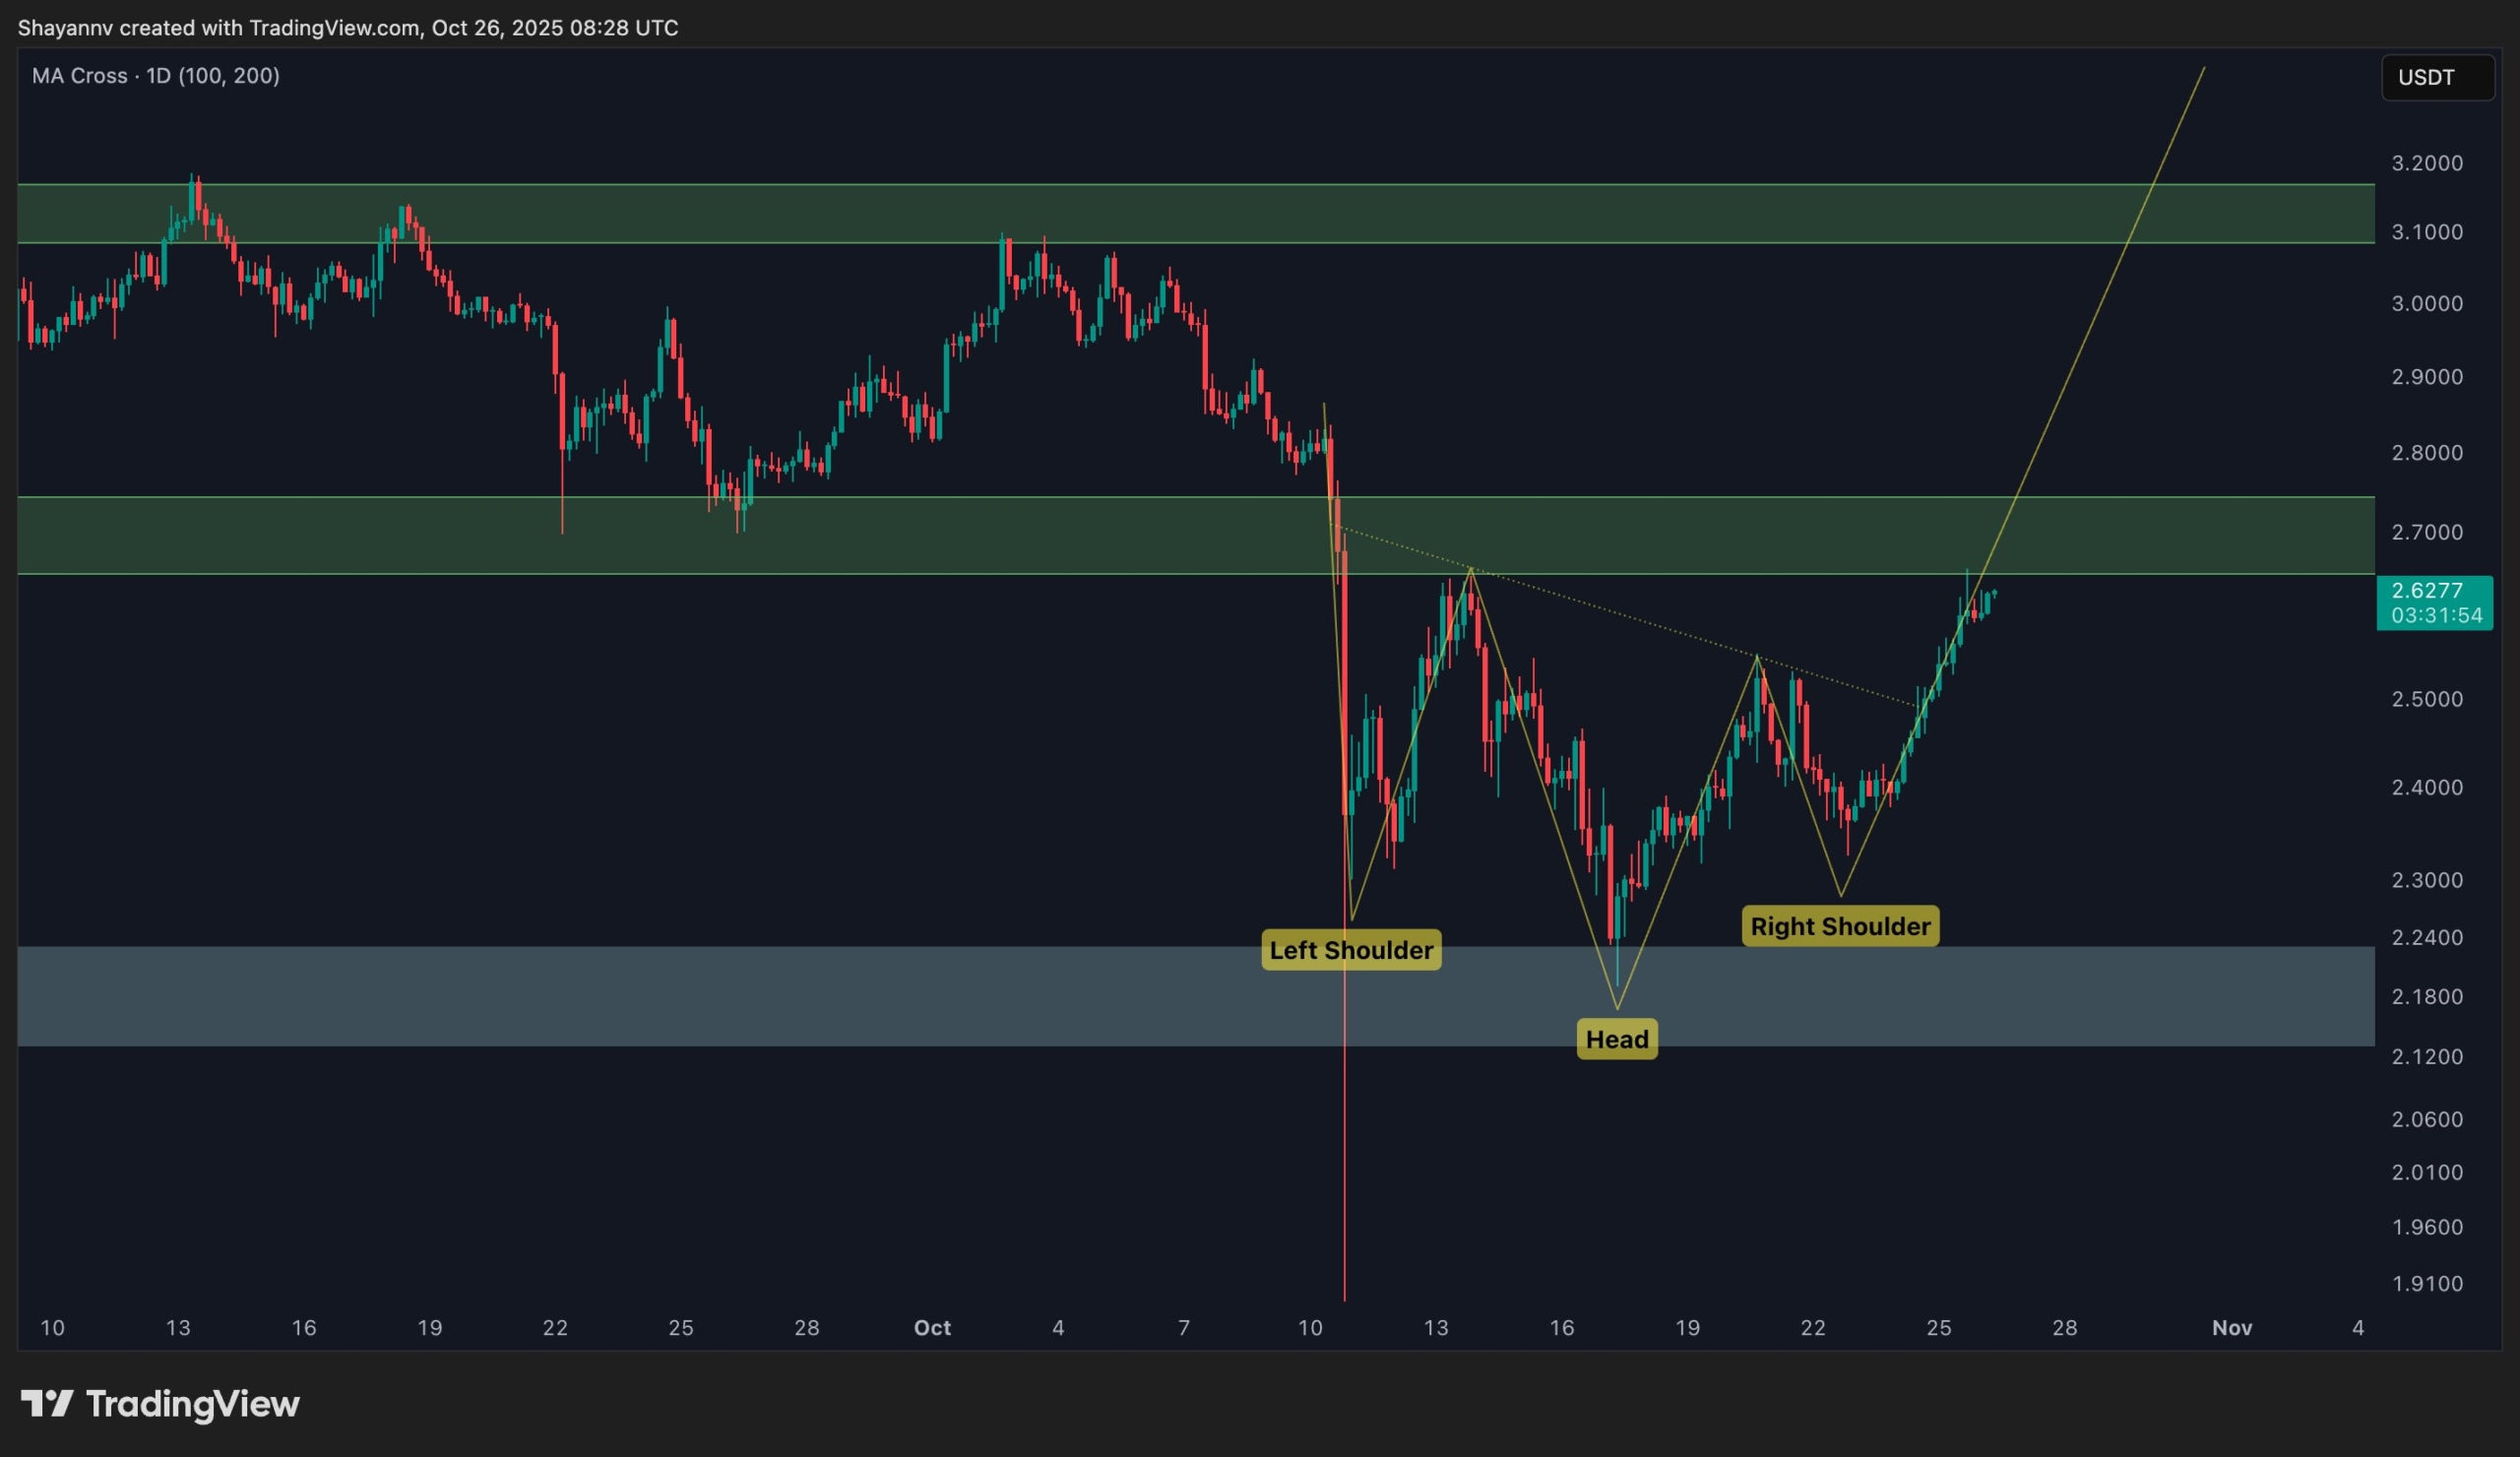
The 4-hour structure shows a clear accumulation pattern forming around the $2.2 support region, which has triggered a strong bullish reversal. The asset’s recent breakout from an inverted head-and-shoulders pattern underscores improving market sentiment, driving the price toward the $2.6 resistance level.
If $XRP manages to retest the broken neckline and establish a stable pullback structure, continued bullish momentum could emerge, with potential targets extending toward $2.8 and beyond. Conversely, failure to maintain momentum above $2.6 may lead to sideways consolidation, keeping the asset range-bound in the short term.