
$BNB price confirmed a bearish double top pattern, right before it grabbed headlines with major exchange listings. Will the token continue its ongoing losses, or could the renewed investor buzz from these listings spark a trend reversal?
- $BNB price is down over 20% from its all-time high.
- Robinhood and Coinbase have listed $BNB, and Polymarket has expanded to $BNB Chain.
- Technical indicators remain largely bearish in the short-term with subtle signs of relief.
According to data from crypto.news, $BNB ($BNB) has dropped 8% over the past 7 days and 20.7% from its all-time high of $1369.99 reached on Oct. 13. Trading at $1,087 at the time of writing, the token has gained nearly 2% after it secured a listing on multiple high-profile exchanges.
Notably, the U.S.-based popular trading platform Robinhood listed $BNB on Wednesday, Oct. 22, giving the token broader exposure to retail investors across the U.S. Just a day later, Coinbase, the largest crypto exchange in the U.S., also added support for $BNB.
Listings on top-tier platforms like Robinhood and Coinbase typically tend to spark renewed community interest, elevate a token’s visibility, and boost its perceived credibility.
At the same time, leading decentralized predictions market Polymarket has expanded to the $BNB Chain, and the integration is expected to offer a more cost-effective and efficient experience for users, which can drive increased liquidity for $BNB and strengthen $BNB Chain’s decentralized finance ecosystem.
Although $BNB price may continue to experience price swings in the short term, especially given the broader market’s bearish tone amid ongoing macroeconomic uncertainty, these recent developments have helped create a strong bullish narrative underneath, which could gradually unfold into a sustained recovery once market sentiment improves.
$BNB price analysis
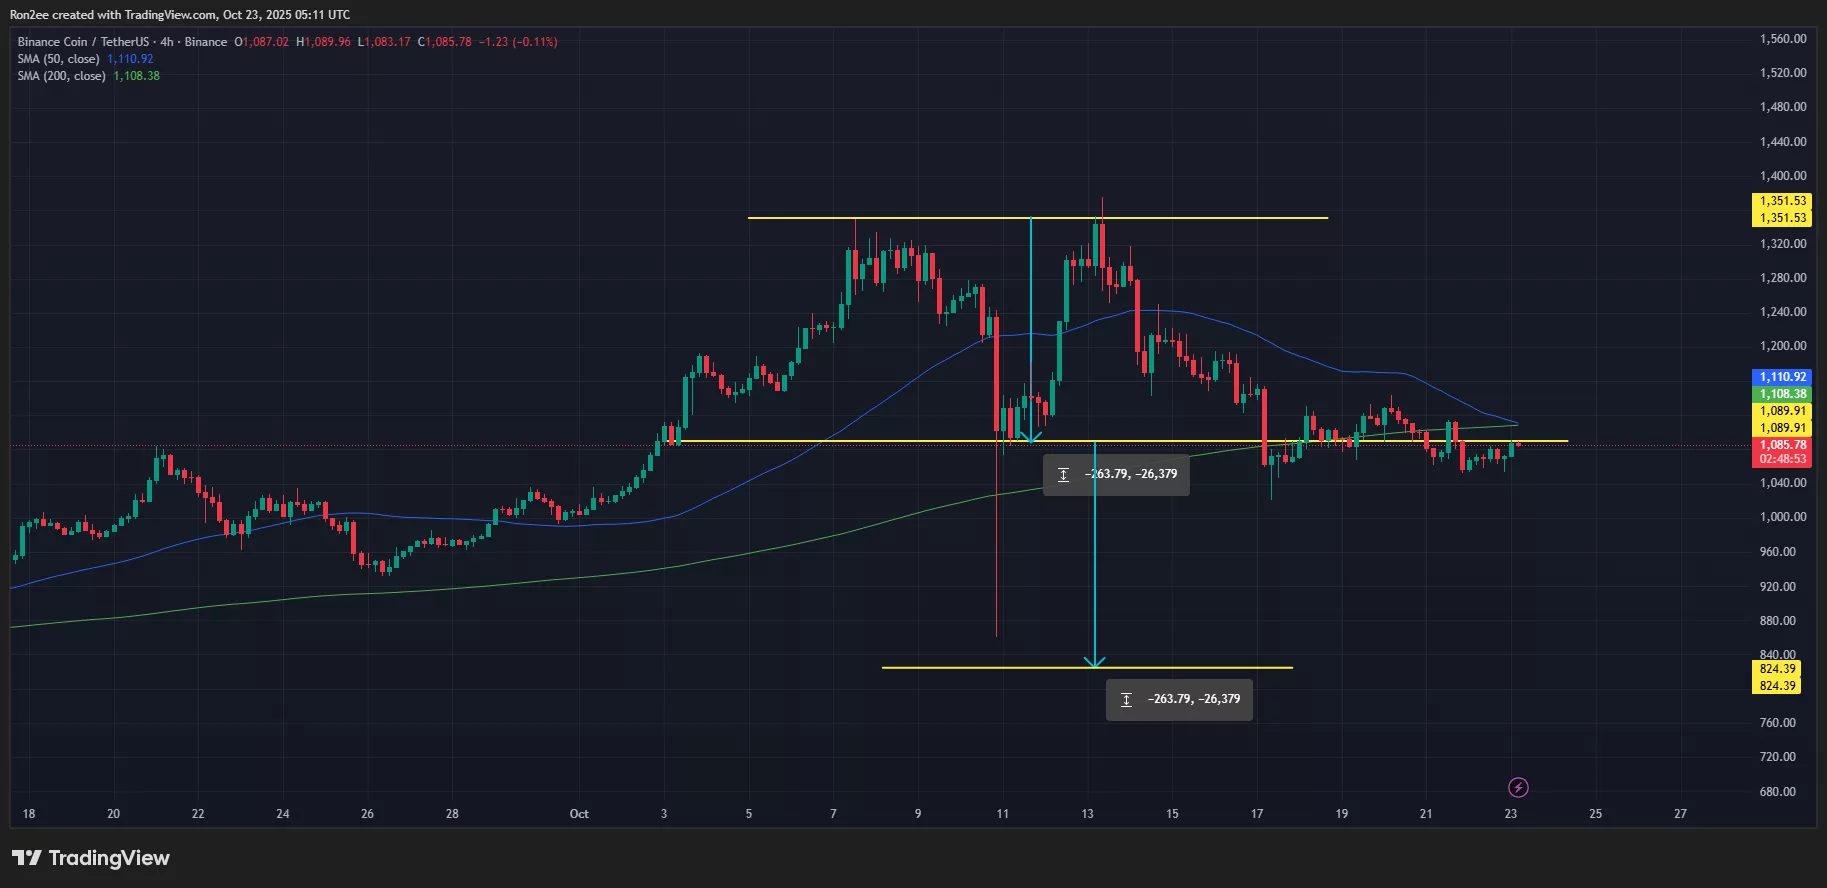
For now, the short-term outlook remains tilted towards the bearish side, especially as $BNB has confirmed a textbook double top pattern on the 4-hour chart. Traders view this as a bearish reversal pattern, which typically precedes a deeper correction.
 $BNB price has confirmed a double-top pattern on the 4-hour chart.">
The two peaks formed near the $1,351 mark, each showing strong rejection wicks at the highs that point to buyer exhaustion. The neckline of the pattern sits at $1,087, and as of press time, $BNB was trading right at that level, leaving it highly prone to volatility.
As of press time, $BNB price was trading at he neckline level, making it highly prone to volatility.
$BNB’s moving averages also add to the bearish bias. The 50-day moving average is closing in on the 200-day, setting up a possible death cross, a signal that in past cycles has marked prolonged declines
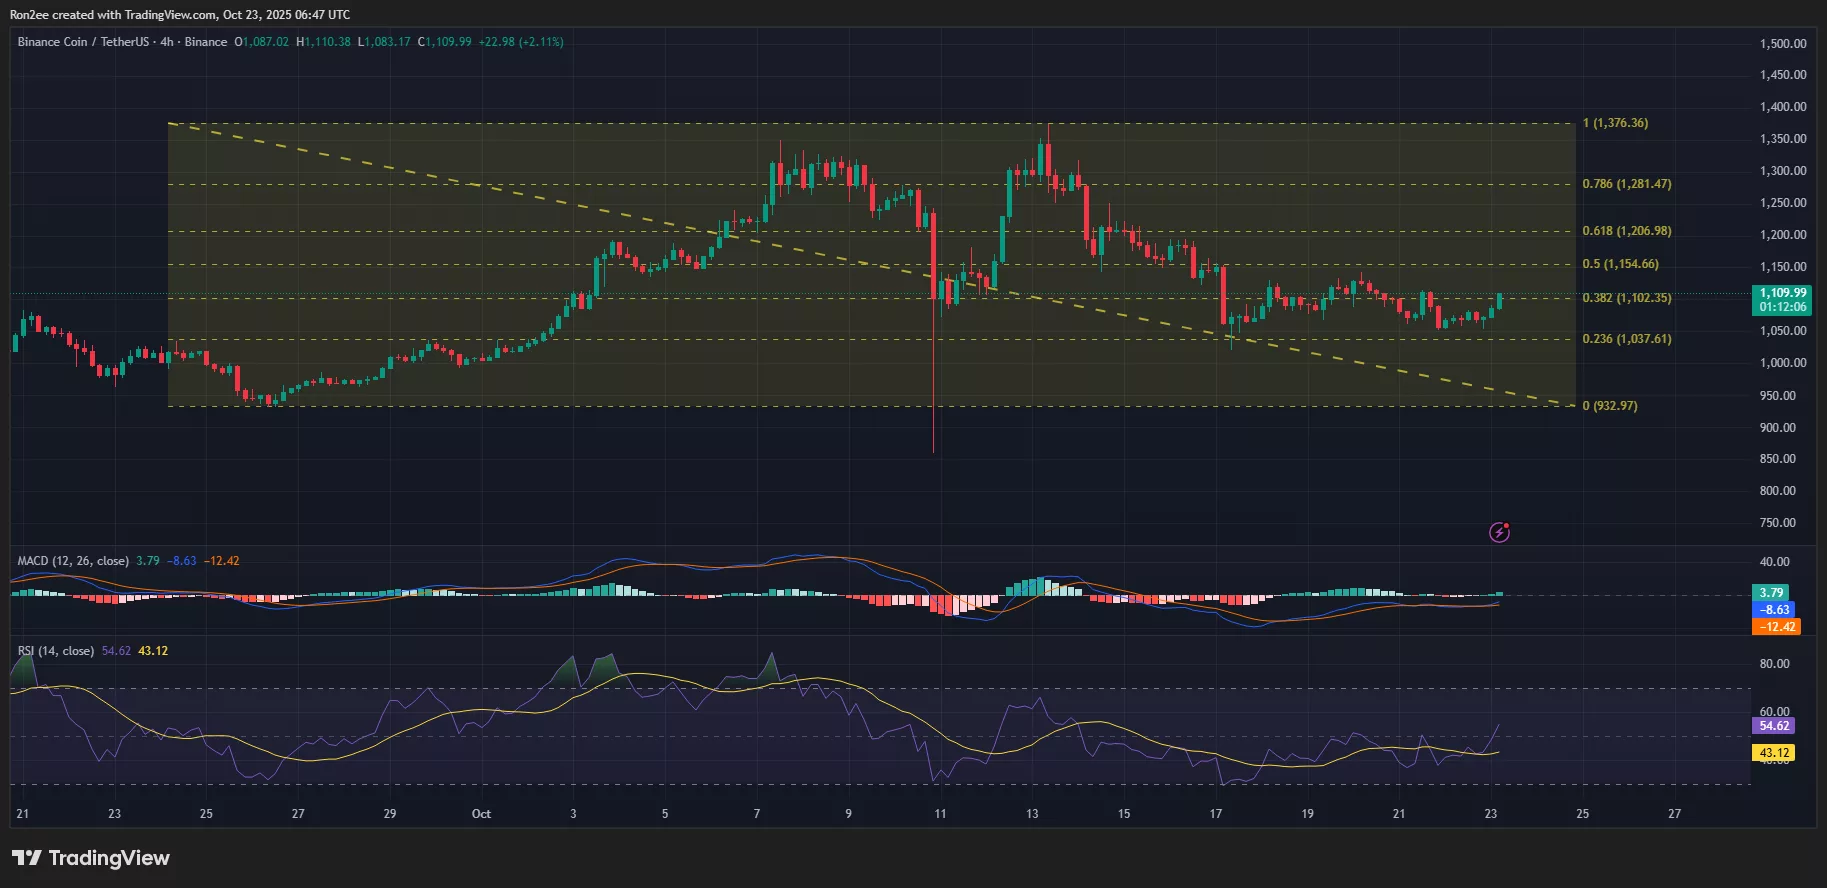
However, momentum indicators paint a slightly different picture. The MACD line has crossed above the signal line, hinting at a subtle shift in momentum toward buyers, even though it doesn’t confirm a full reversal. The RSI has also climbed above the neutral 50 threshold, lending some support to the short-term recovery view.
 $BNB price, MACD, and RSI chart.">
For now, $1,037, which aligns with the 23.6% Fibonacci retracement level, acts as the immediate support level for $BNB. A drop below it could lead to a free fall to $824, a target measured by subtracting the height of the double-top formed from the levels at which it confirmed the pattern. As such, the target lies 24% below the current price when writing.
However, if $BNB bulls can push the price above $1,111, the 50-day SMA with strong volume, it could invalidate the bearish setup and open the door for a potential move toward $1,150, the next key psychological resistance level on the chart.
Disclosure: This article does not represent investment advice. The content and materials featured on this page are for educational purposes only.