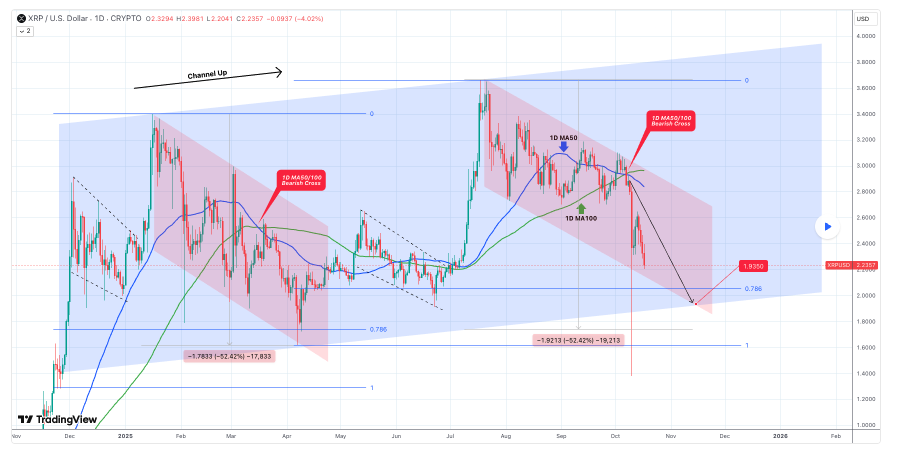
The price has broken below the mid-range of the ascending channel, signaling growing downward momentum.
$XRP key price levels to watch
The analyst noted that a bearish crossover between the 1-day 50-day and 100-day moving averages has reinforced the negative outlook, echoing a similar signal earlier this year that drove $XRP below the 0.786 Fibonacci retracement level.
If the current decline follows the same pattern as the previous drop, $XRP could lose more than 50% from its recent levels.
At the same time, fibonacci support levels point to a key downside target at $1.93, with a deeper slide potentially extending to $1.75, still within the broader ascending channel.
The bearish outlook is reinforced by weak market sentiment, a lack of bullish catalysts, and renewed U.S.–China trade tensions, which continue to pressure risk assets.
$XRP price analysis
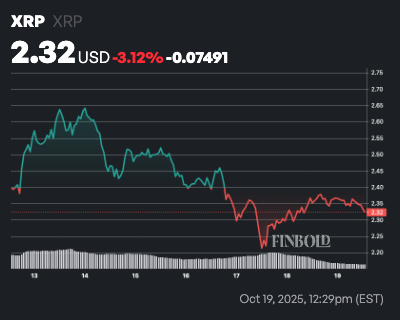
By press time, $XRP was trading at $2.32 having modestly plunged by about 1.5% in the past 24 hours while on the weekly timeline, $XRP is also in the red at 3%.
Meanwhile, $XRP is trading below both the 50-day SMA at $2.85 and the 200-day SMA at $2.62, reinforcing a bearish trend and suggesting further downside risk unless it recovers these levels.
The 14-day RSI at 30.25 signals weak buying momentum and rising selling pressure, though its proximity to oversold territory hints at the possibility of a short-term relief bounce.
Featured image via Shutterstock

 finbold.com