
$BNB has surged to a new all-time high today, fueled by renewed bullish sentiment and fresh capital inflows into risk assets amid a weakening US dollar.
However, beneath the surface, on-chain data tells a different story. User activity on the $BNB Chain has been on a steady decline since late September, signaling that the user demand on the network is weakening even as prices soar. What does this mean?
$BNB’s Bull Run Faces Risk
$BNB’s price has surged 25% over the past week, making it the best-performing asset among the top five cryptocurrencies by market capitalization. This double-digit rally pushed the token to a new all-time high of $1,263, where it reached earlier today.
However, there’s a catch. On-chain data reveals that while $BNB’s price has climbed sharply, user activity on the $BNB Chain has been trending downward.
For example, Glassnode data shows that the $BNB Chain’s daily new address count has declined by 57% since September 24, marking a sharp slowdown in network growth.
For token TA and market updates: Want more token insights like this? Sign up for Editor Harsh Notariya’s Daily Crypto Newsletter here.
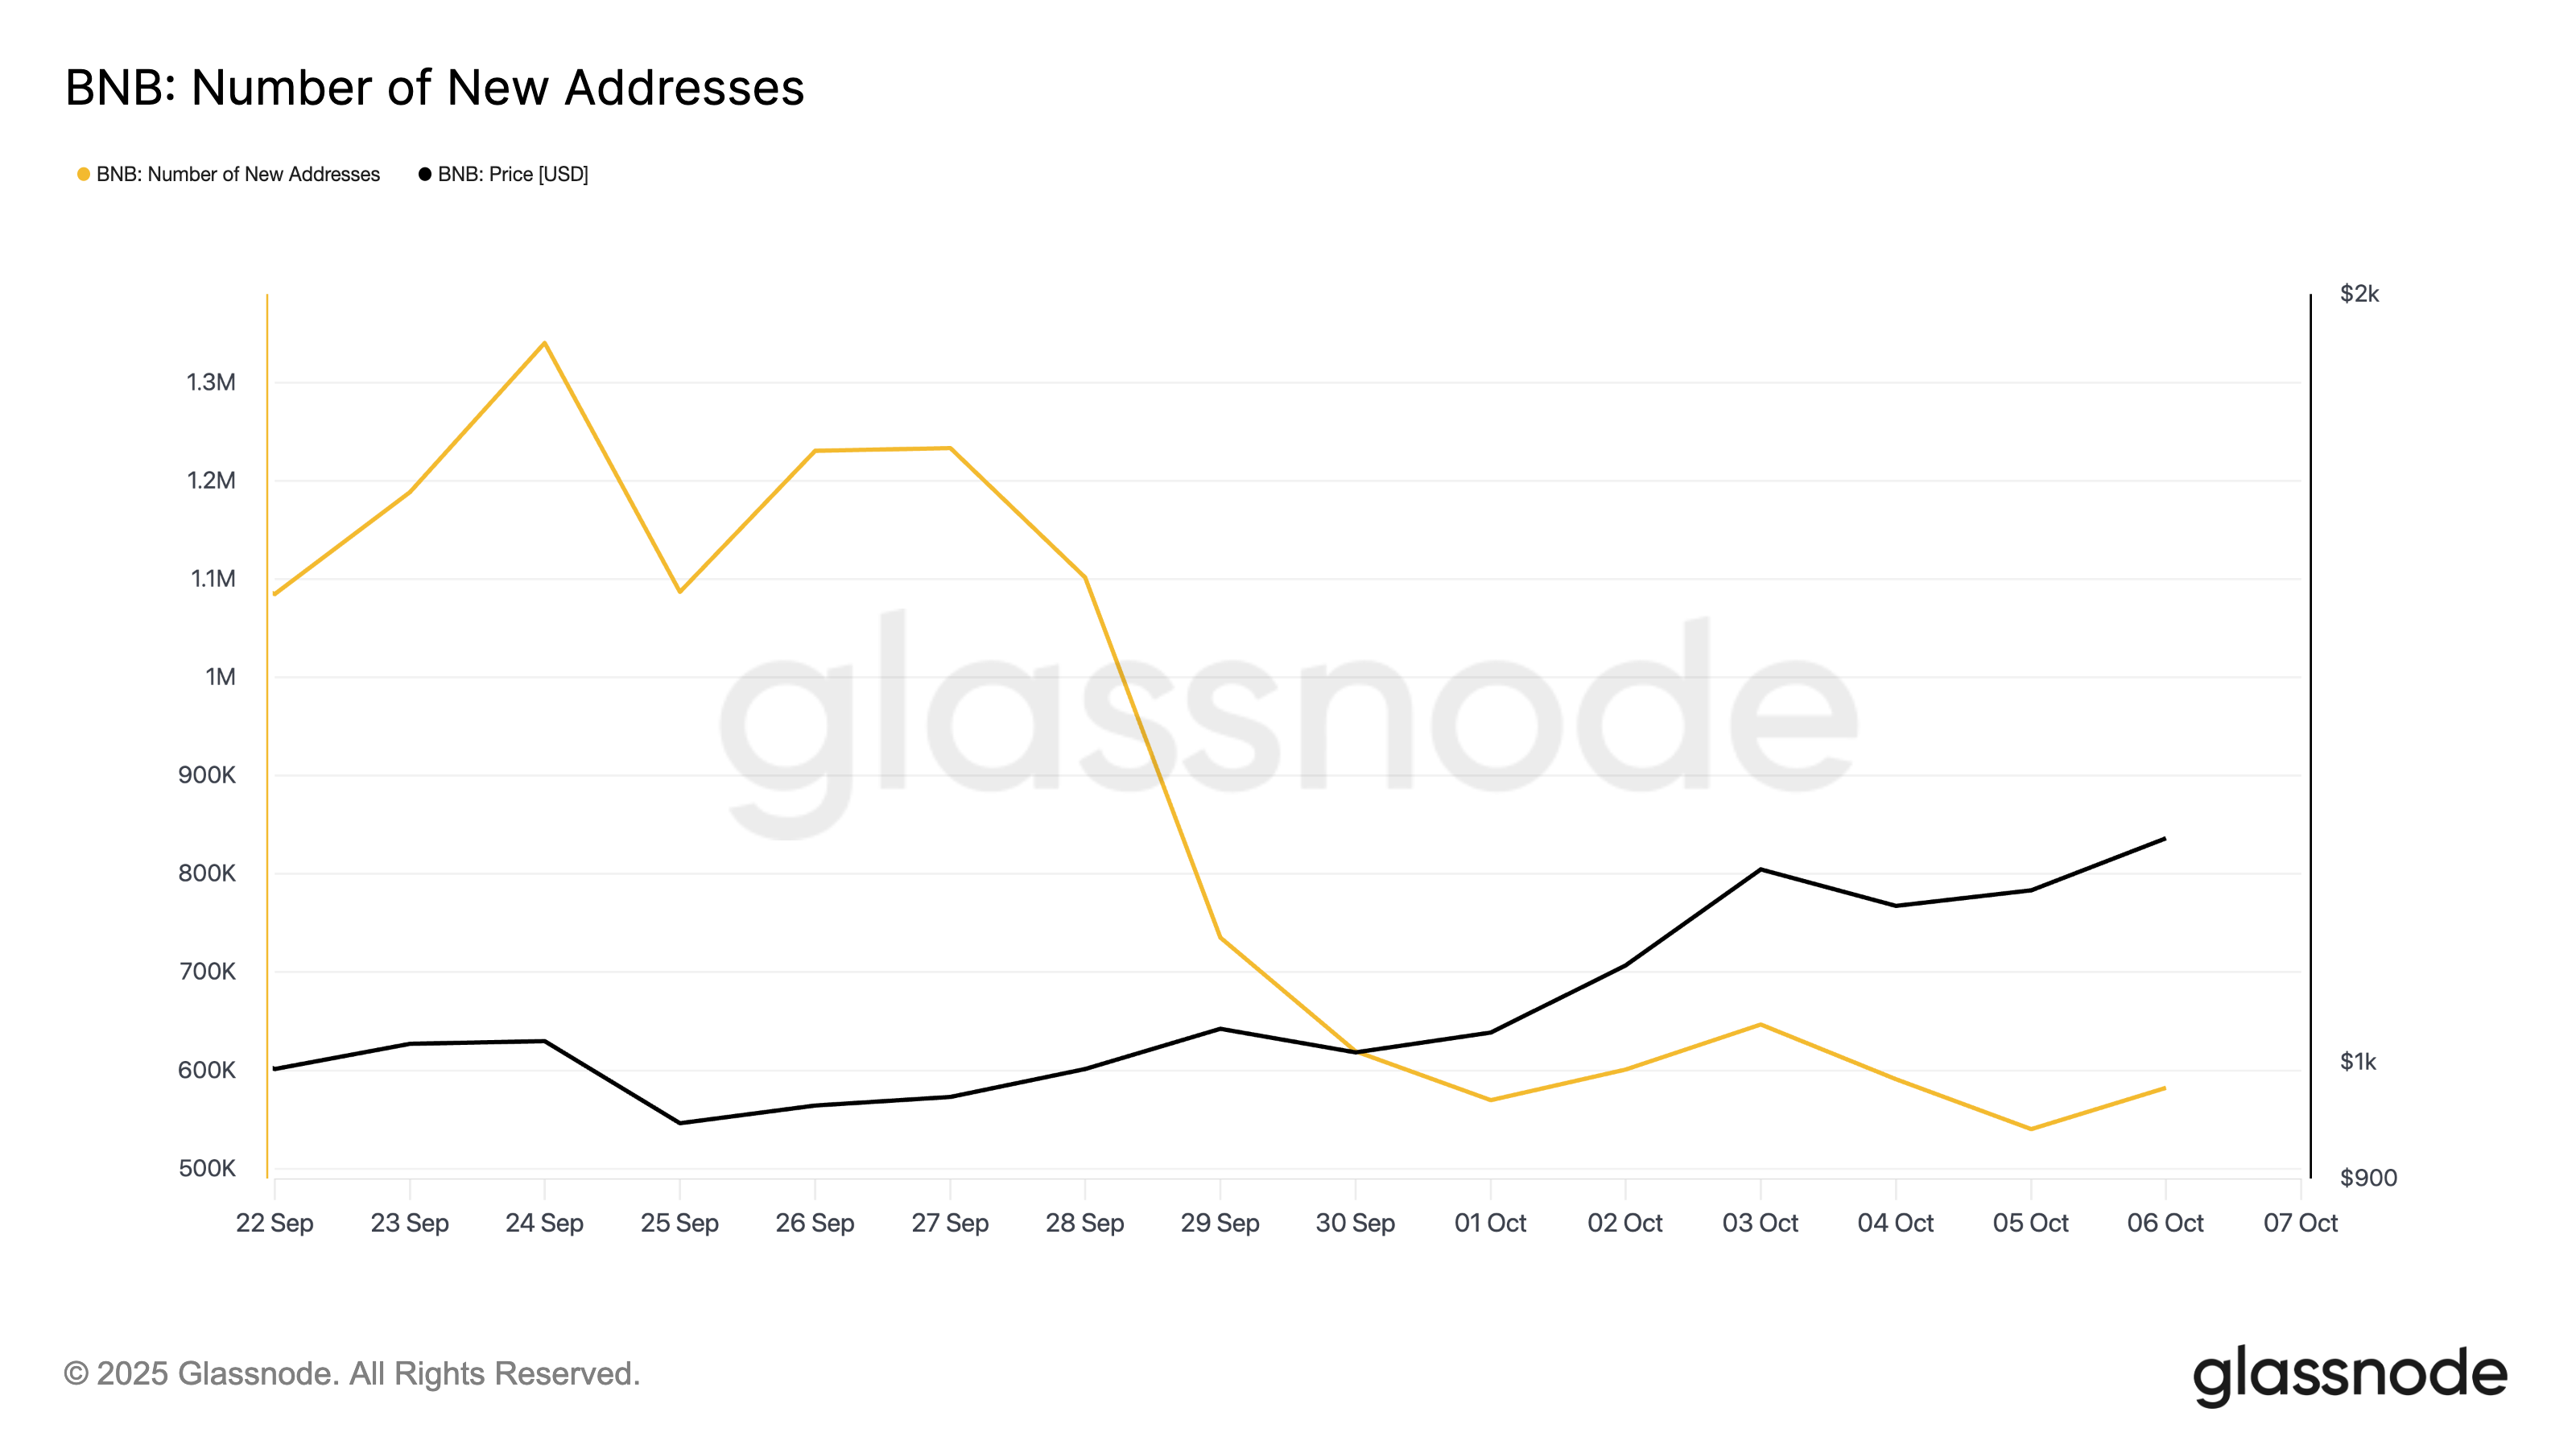 $BNB Number of New Addresses">
A drop in a network’s new address count signals weakening demand and lower user participation. New addresses typically rise alongside price in healthy market rallies as more users join in.
Therefore, the divergence noted in $BNB’s case signals that the price surge is not driven by new demand for the coin or an uptick in network activity. This puts it at risk of a pullback in the near term.
$BNB Bulls Are Losing Steam
Furthermore, readings from $BNB’s Relative Strength Index (RSI) hint at potential buyers’ exhaustion, which could trigger a price correction in the near term. At press time, this momentum is at 75.79, signaling that the altcoin is overbought, and its upward momentum could soon fade.
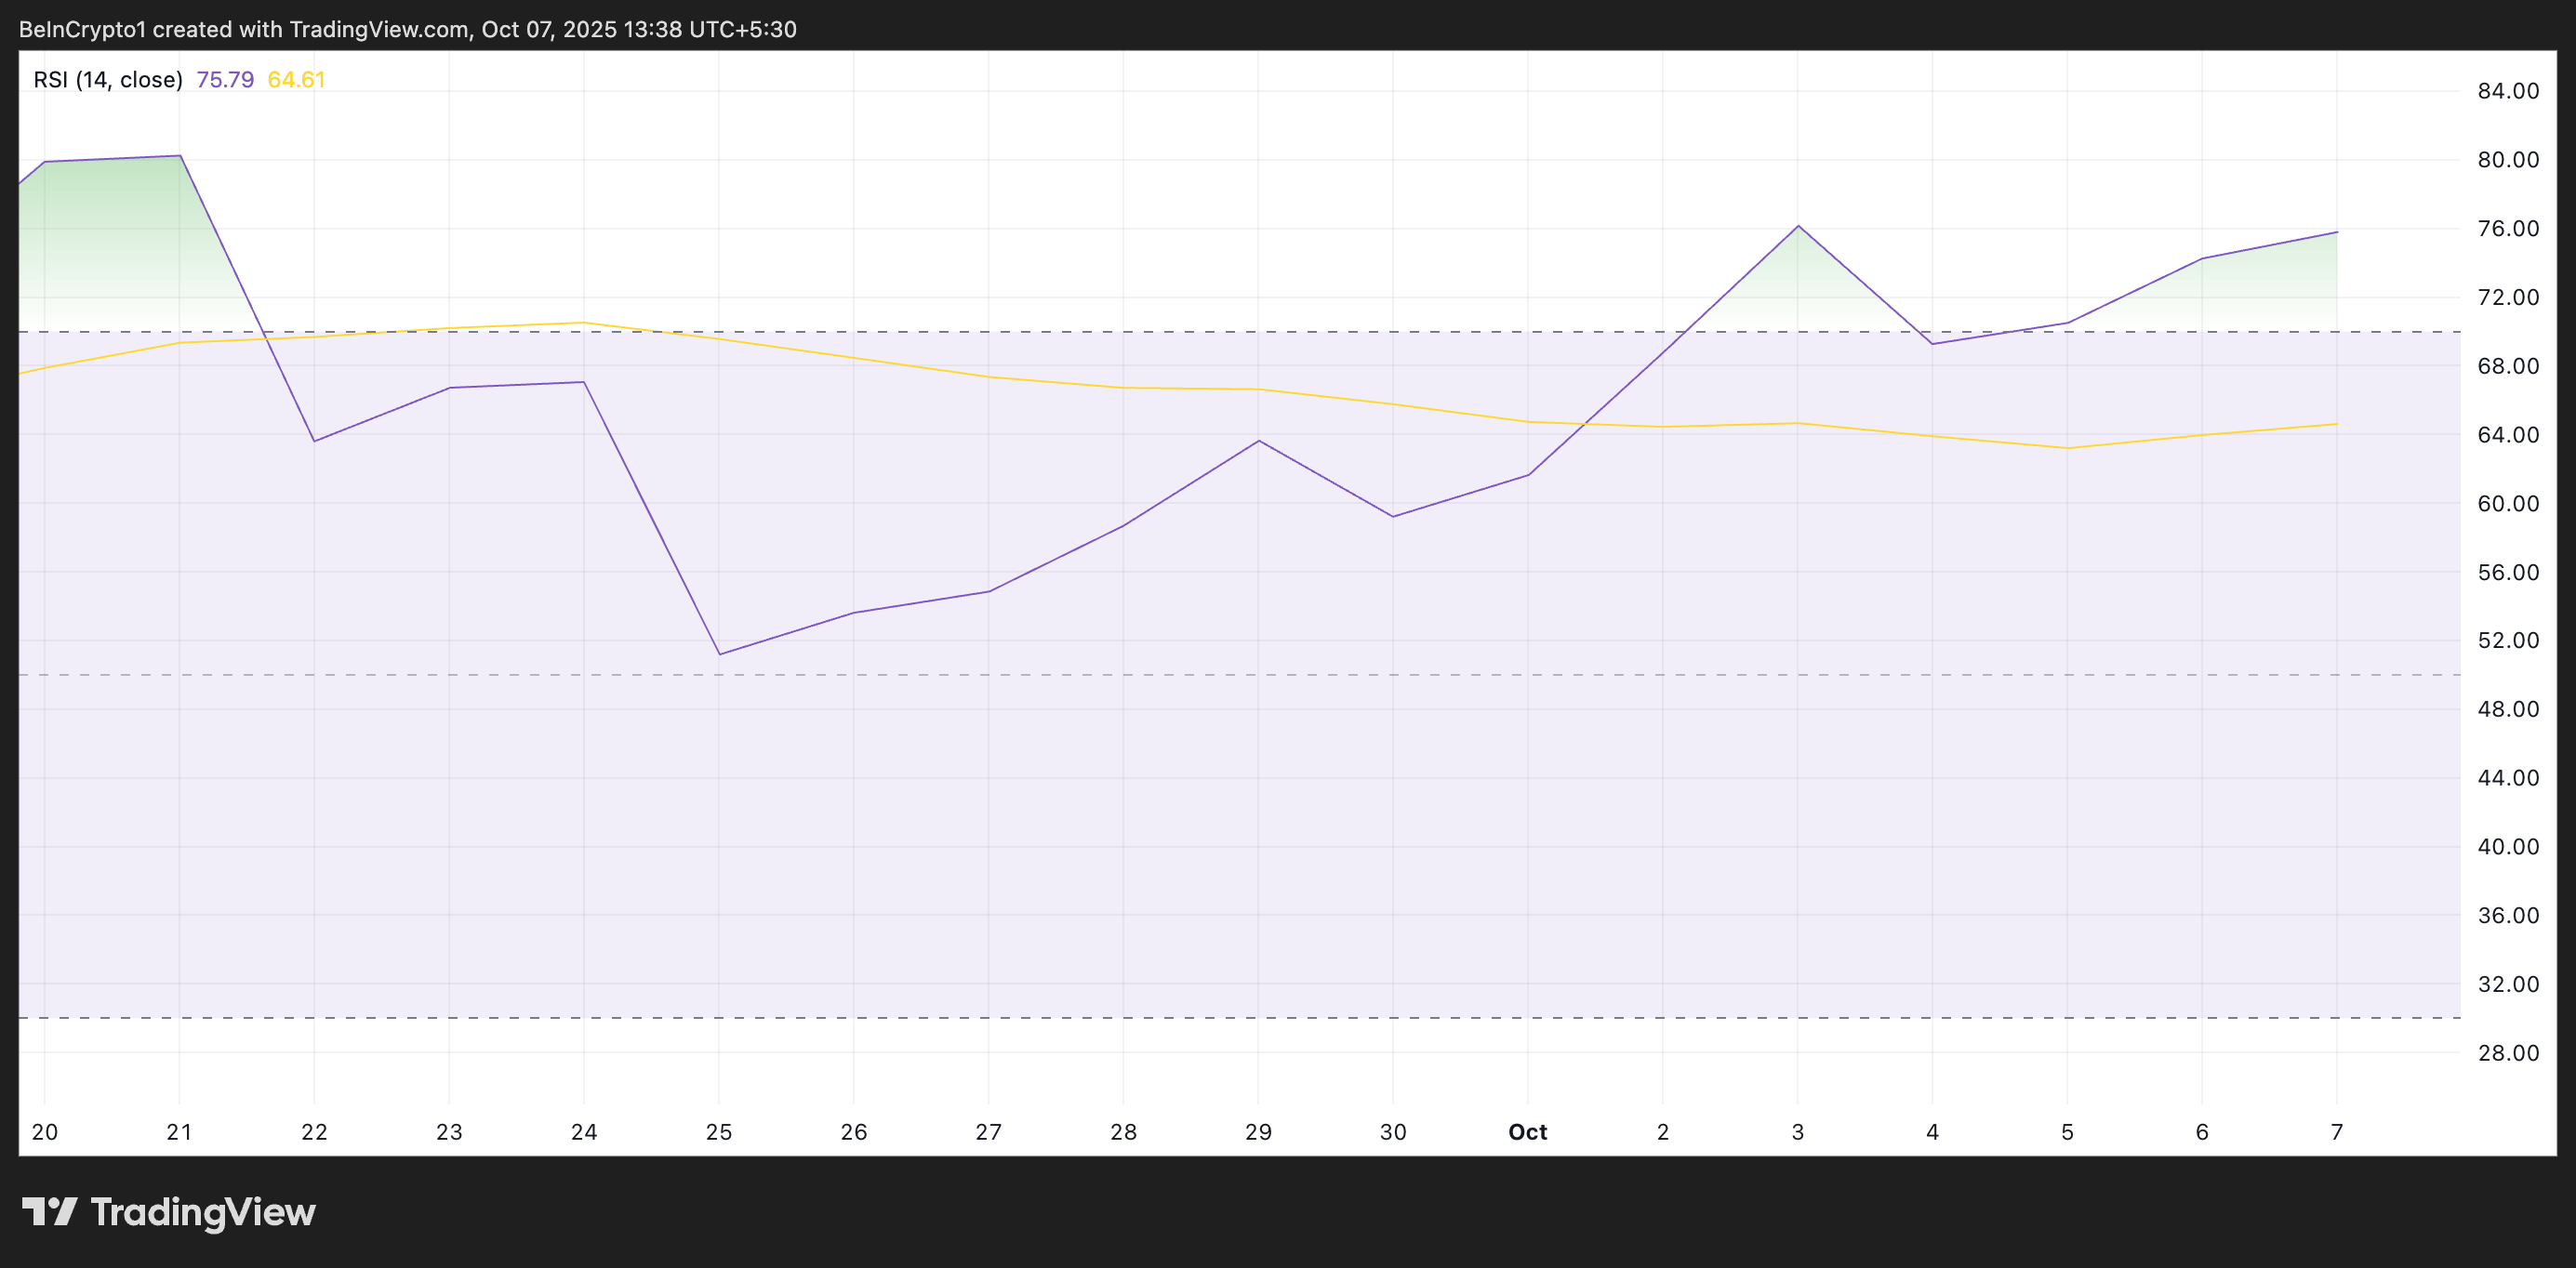 $BNB RSI.">
The RSI indicator tracks an asset’s overbought and oversold market conditions. It ranges between 0 and 100, with values above 70 suggesting that the asset is overbought and due for a price decline. Conversely, values under 30 indicate that the asset is oversold and may witness a rebound.
At 75.79, $BNB’s RSI signals that it is becoming significantly overbought. With no real demand backing the rally, a pullback is inevitable in the near term.
$BNB Faces $1,100 Test
Without a rebound in network activity to validate $BNB’s price action, its price could dip toward $1,100. If this critical support floor fails to hold, the coin’s price could fall further to $971.80.
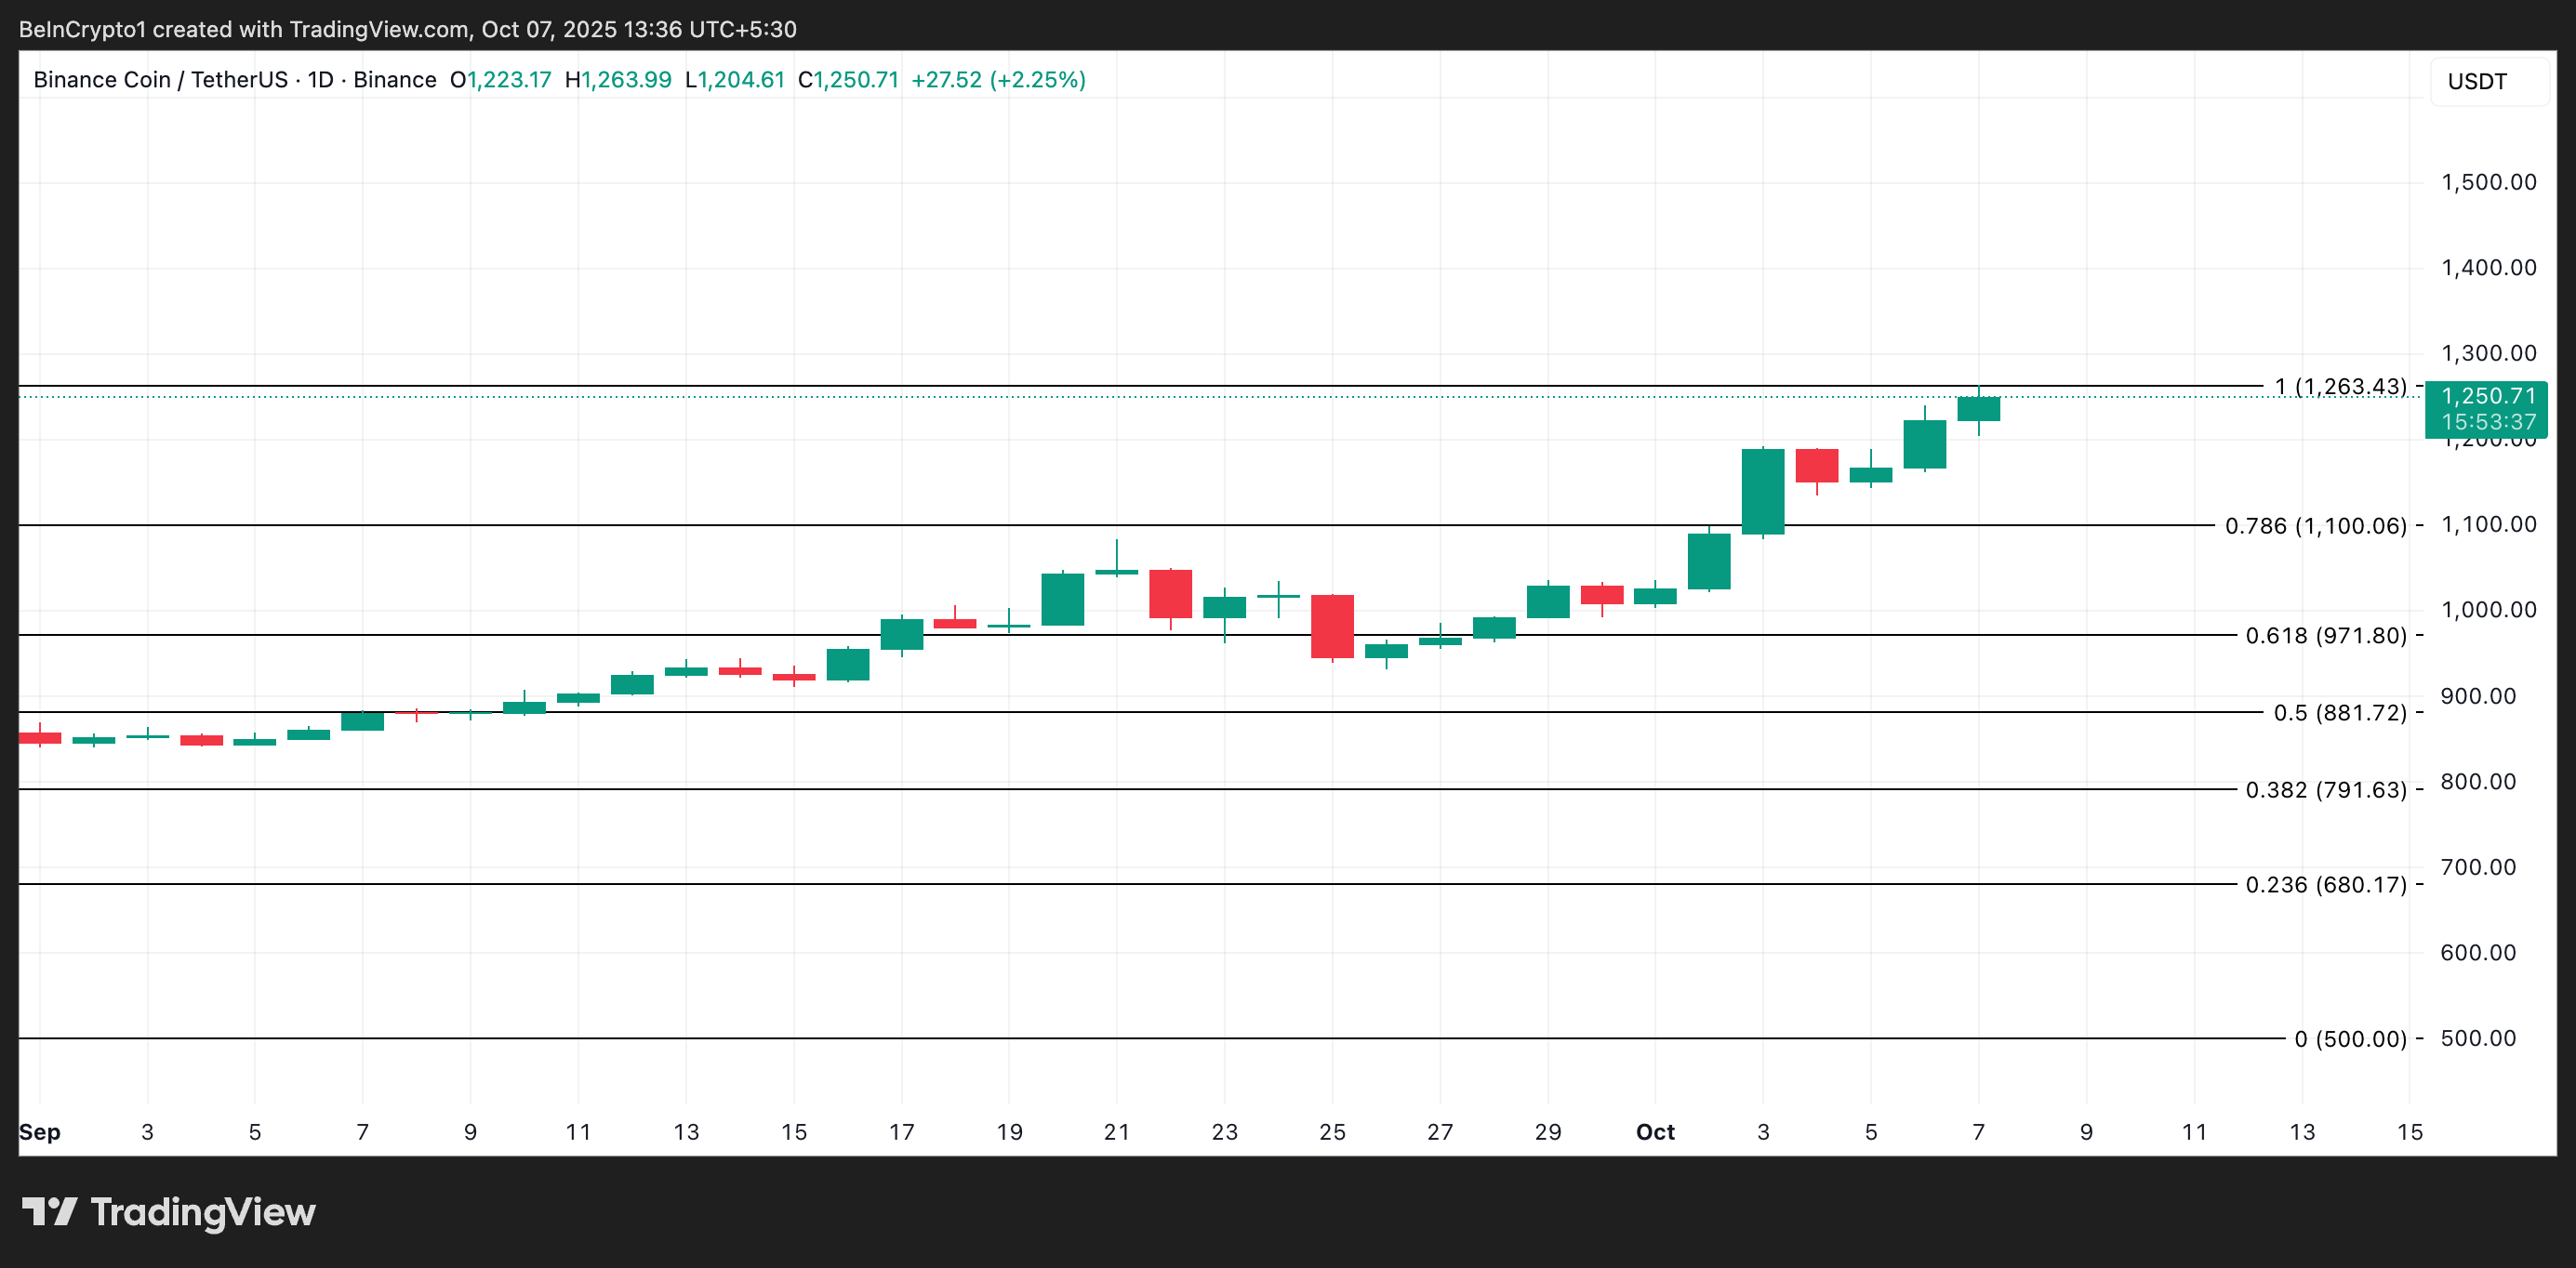 $BNB Price Analysis.">
However, if macro momentum strengthens or actual demand for $BNB soars, its price could register a new price peak over the next few trading sessions.
The post Warning Signs Emerge as $BNB Hits Record Highs While User Activity Plunges appeared first on BeInCrypto.