
Chainlink is trading near $22.52 as new wallets expand and fresh institutional adoption builds momentum, placing focus on the key $24 resistance level.
- Chainlink price hovers at $22.52, with $24 as key resistance.
- Nearly 2,000 new wallets were added on Oct. 1, boosting adoption.
- Technicals show support near $22, with risk of a dip to $20.
Chainlink is trading at $22.52, down 0.9% in the past 24 hours within a weekly range of $20.06–$23.00. The token has dropped 10% in the past week and 4% in the past month, though daily trading volume has risen to $963 million, up 6.1% from the day before. This suggests more market activity is returning even as the price holds below resistance.
Derivatives data from CoinGlass shows Chainlink ($LINK) trading volume at $1.6 billion, down 3.2%, while open interest fell 2.9% to $1.32 billion. This points to fewer leveraged bets, which can ease sharp swings in price. At the same time, adoption on the network is climbing.
Growing network activity
On-chain activity shows signs of strength. Data from Oct. 1, shared by analyst Ali Martinez, revealed that 1,963 new wallets were added to the Chainlink network in a single day, showing expansion in user adoption.
Chainlink $LINK added 1,963 new addresses on October 1, signaling strong network expansion! pic.twitter.com/wa46kVQoAT
— Ali (@ali_charts) October 3, 2025
At the same time, institutional engagement is rising. Chainlink’s reserve, funded by enterprise fees, now holds more than 415,000 $LINK, growing by over 46,000 tokens in a single day.
In addition, at the Sibos 2025 conference, Chainlink secured a major win at the Swift Hackathon and launched DataLink, a tool that lets firms such as Deutsche Börse bring real-time market data on-chain. With exchange balances at six-year lows, these updates point to a tightening supply backdrop that could support higher prices.
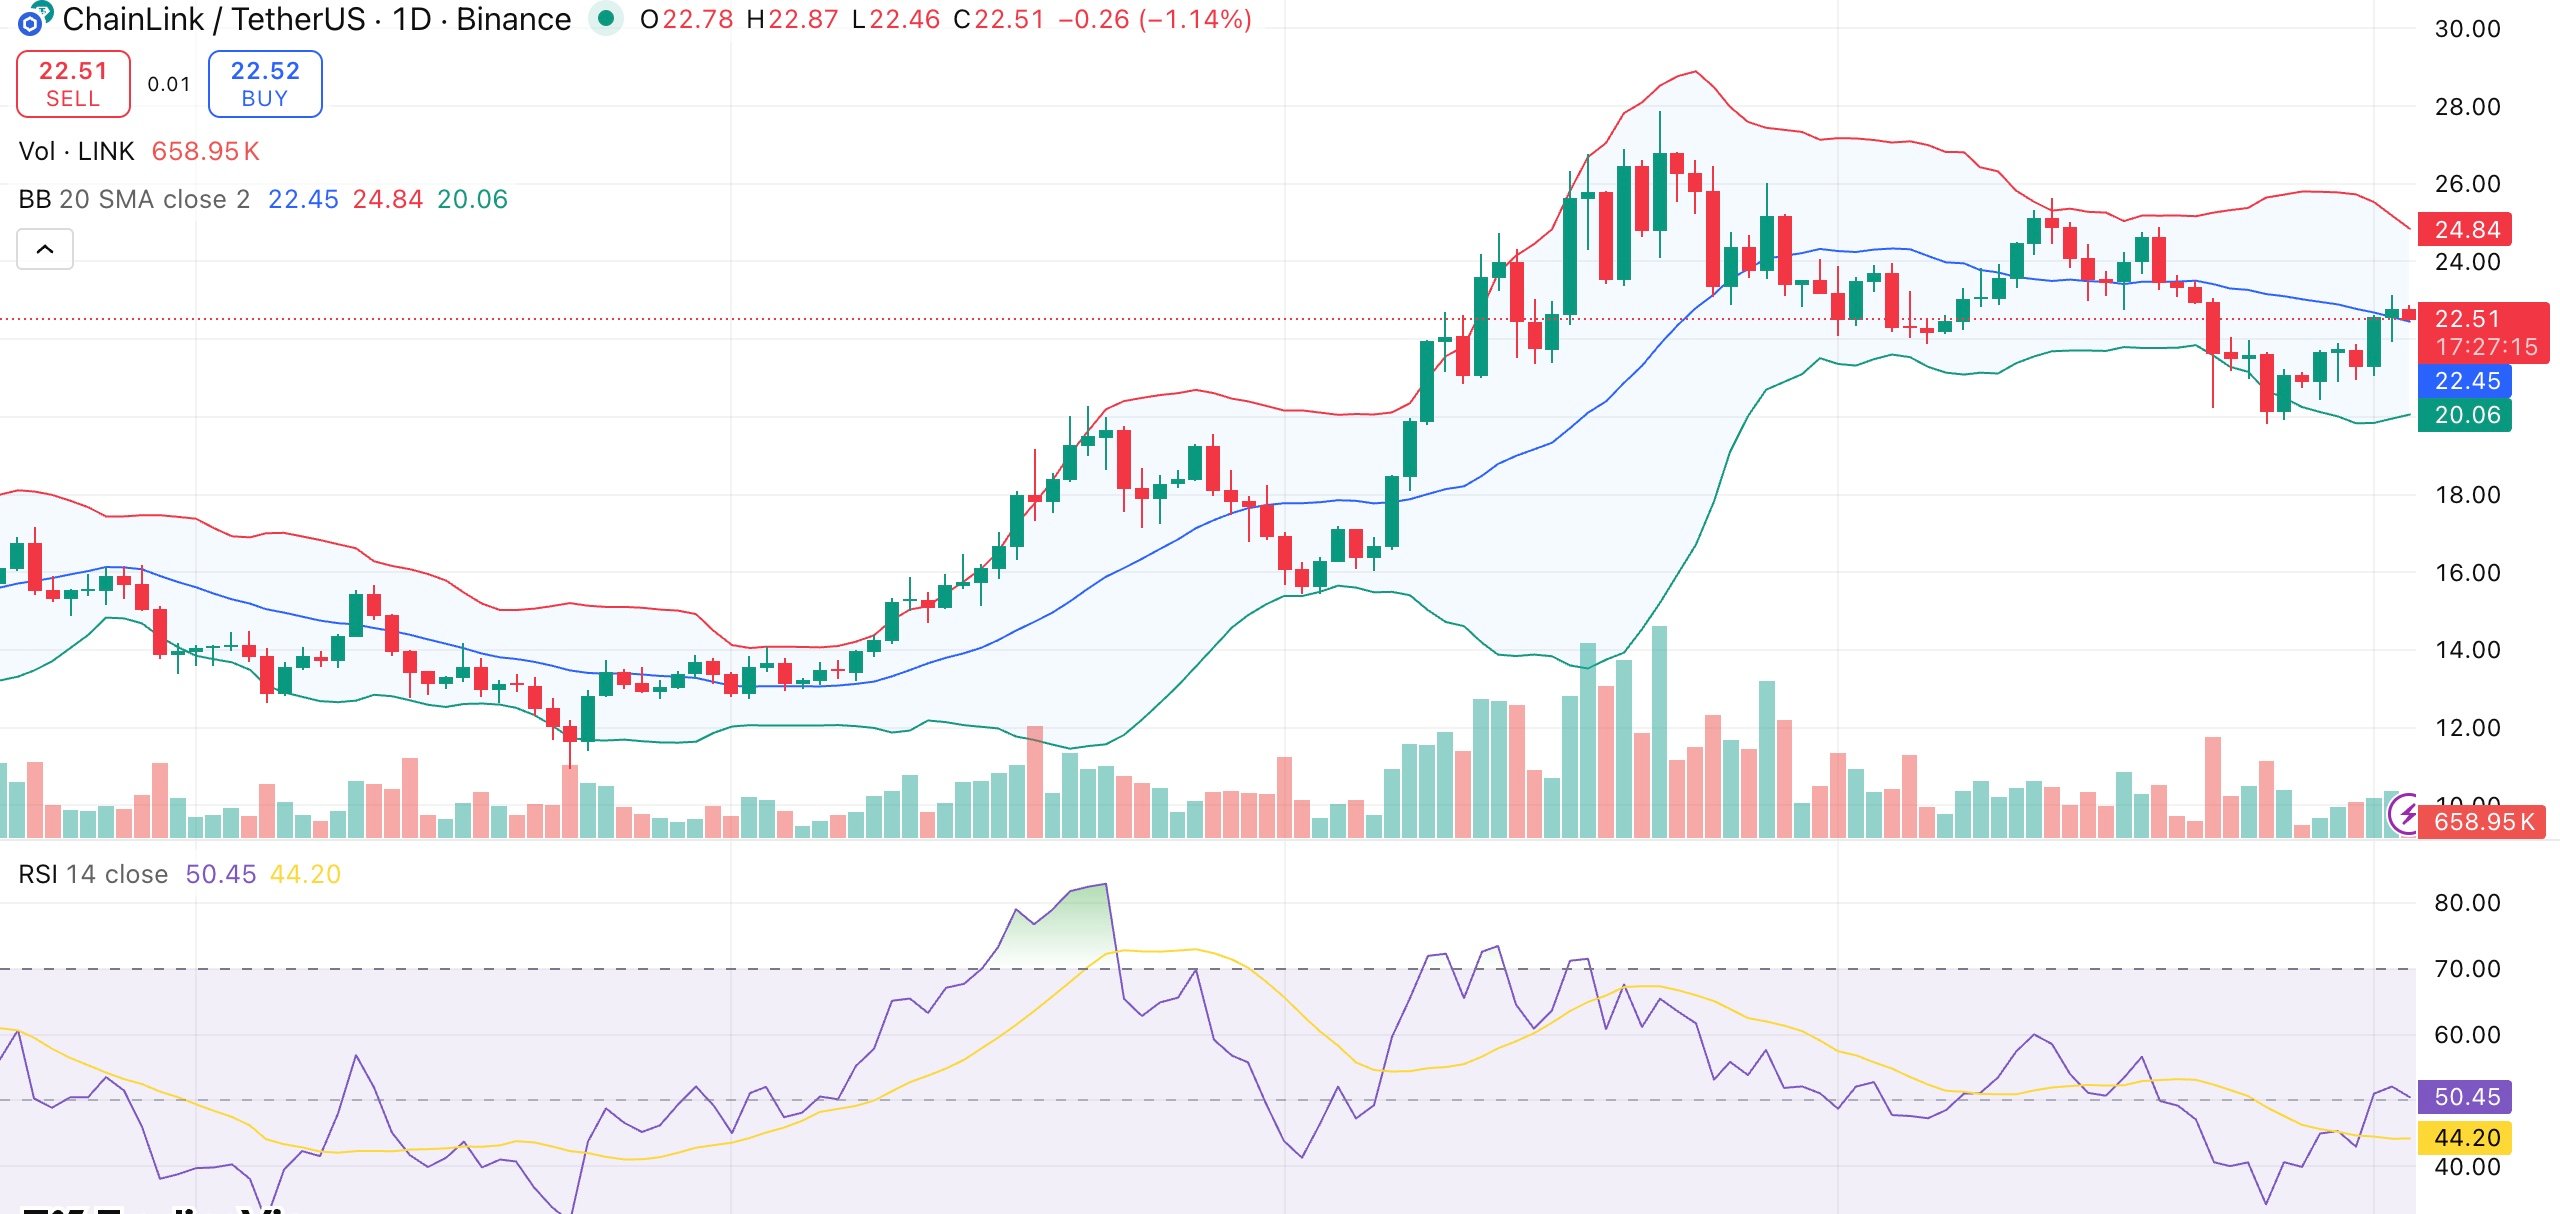
Chainlink price technical analysis
$LINK is currently trading just below the resistance level of $24. The relative strength index at 49.6 indicates balanced momentum, while the majority of indicators are neutral. Short-term averages around $22 offer support, while the MACD indicates a slight upward bias.
Before a breakout, medium-term averages serve as barriers, such as the SMA30 at $22.7 and the SMA50 at $23.3. The overall trend is maintained by the significantly lower longer-term moving averages.
If $LINK pushes above $24, Stronger inflows and adoption could lead to the next targets of $27 to $30. However, the price might drop back to the $20 range if it is unable to maintain support at $22. The market is at a crossroads right now, with fundamentals pointing upward and short-term momentum still cautious.