Calm after the storm of DASH cryptocurrency lasts for 4 weeks. In December, buyers failed to keep the global trend line, which was the beginning of a new powerful fall impulse by almost 50%. It was possible to stop the aggression of sellers for a while near the $95 mark. Can we say that the DASH market has culminated in sales and now consolidation for a reversal is formed? Unfortunately, the trading volumes deny this. 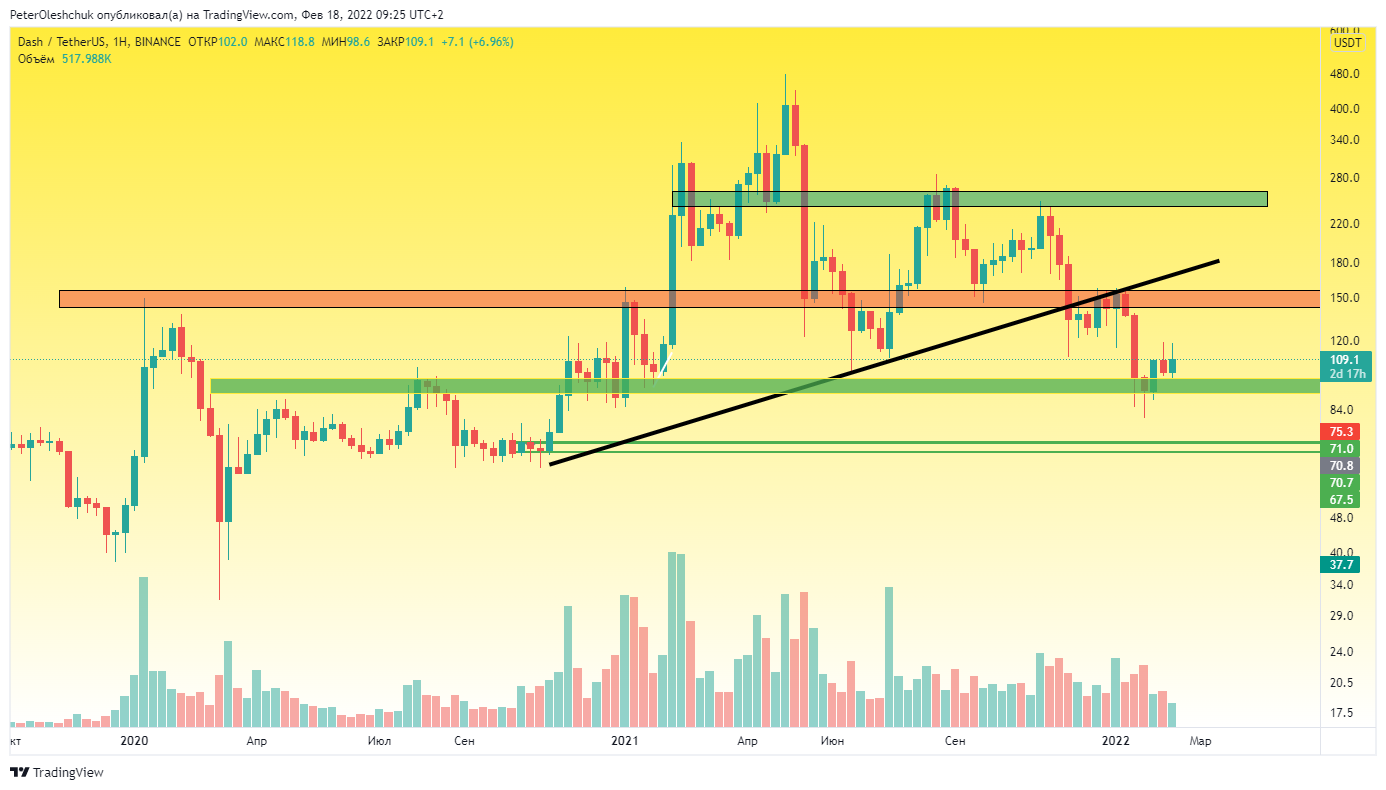 https://www.tradingview.com/x/JnPVpmeY/ At first, buyers failed to strictly stop the price at around $95. The DASH price first broke this range and it happened at medium volumes. And the new current growth wave looks rather weak and buyers do not hint at the desire to act. Currently, the positive scenario in the DASH market is the price growth to $145. In all probability, this growth will be as slow as possible and with deep corrections. And it is in this range that we should expect a new blow from sellers.
Technical Analysis Of DASH On The Daily Timeframe
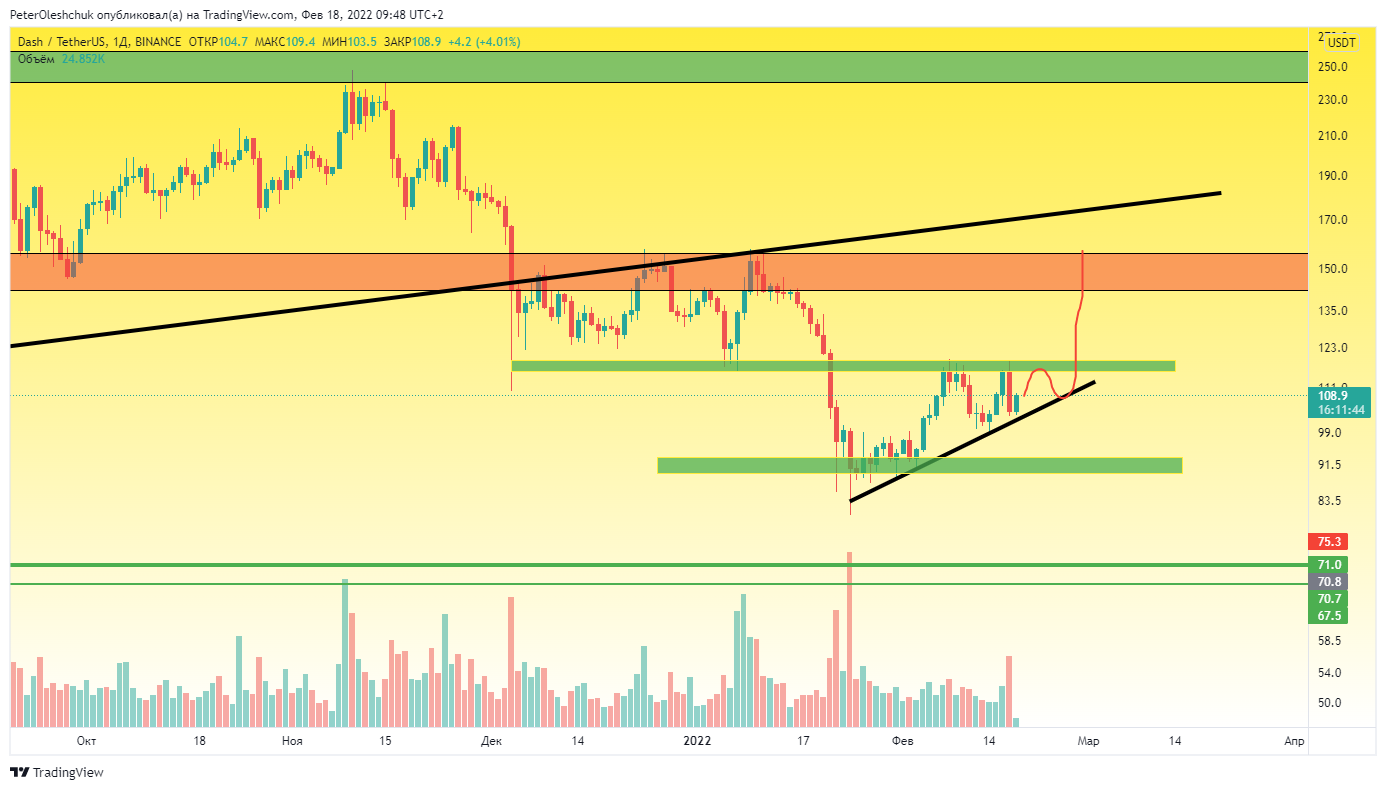 https://www.tradingview.com/x/8sL8EeUJ/ Analyzing the movement of the DASH price on the daily timeframe, we can see the formation of a consolidation triangle with a flat top. On 17 February, sellers did their best to disrupt this consolidation. The aggressively closed daily candle blocked the results of buyers for the previous two days. Trading volumes are increased. However, the local low has not been updated and buyers have another chance to break the $117 mark. Though, in time it may last until the end of February. If buyers can't keep $104, they will have to defend again in the $89 range. The daily timeframe shows that it was at this point that buyers began to actively gain a position for the local growth wave. Thus, the trading range will expand and consolidation will be delayed for a longer period. Given the fact of a weak rebound, we should expect a negative scenario in the DASH market. If we notice low activity near the $89 mark and the BTC price continues to fall below $38,000, the probability of continuing to fall to $70 will be as high as possible.
The DASHBTC Price Continues To Remain In The Intriguing Wedge
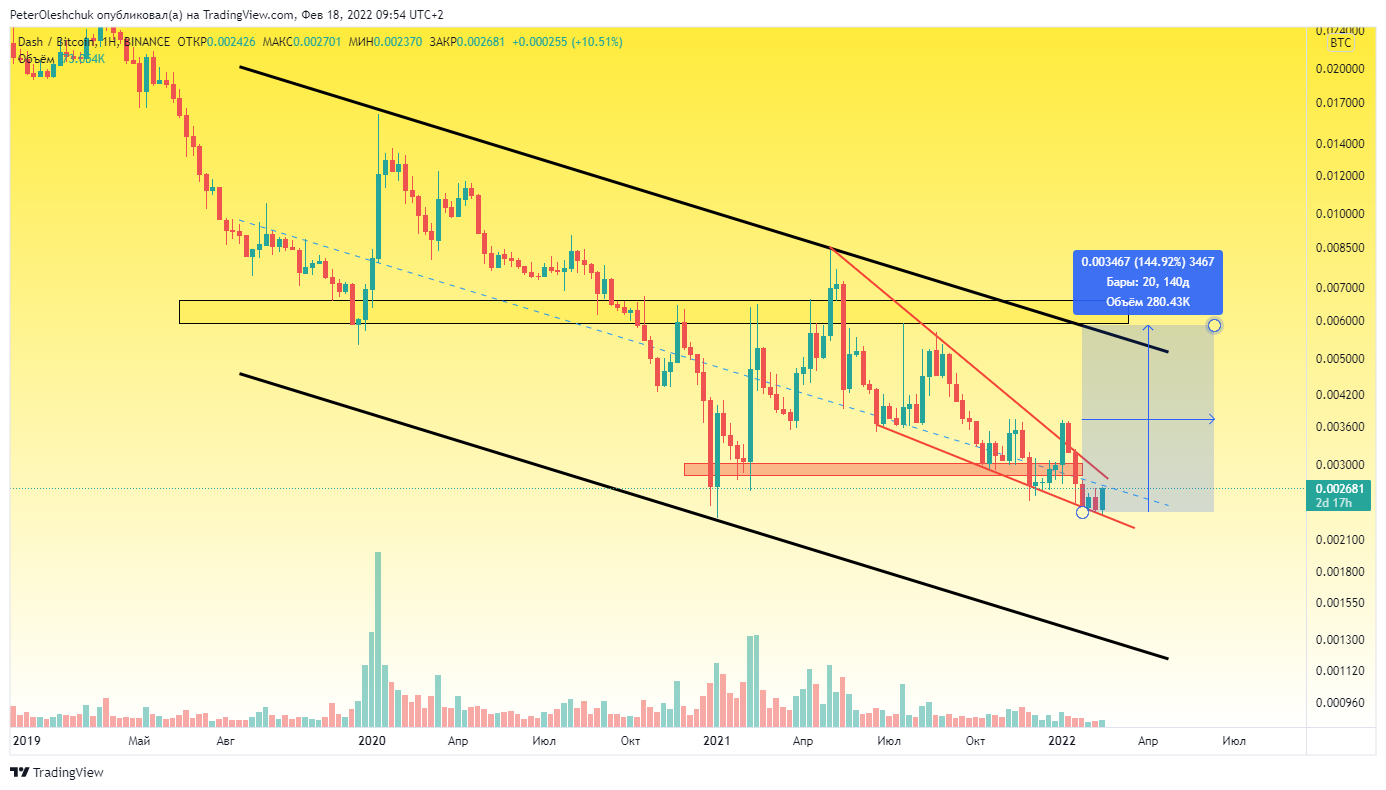 https://www.tradingview.com/x/dza2BLUK/ Unfortunately, on the DASHBTC chart, buyers failed to fix above the important liquidity level 0.0028. Now on the weekly timeframe, sellers are trying to stay below this range. But, buyers managed to keep the price within the global wedge, in which the DASH price has been trading since May 2021. If buyers manage to break this wedge up - we will expect a sharp growth wave of 140%. This scenario fits into our positive outlook with the DASHUSDT price growing to $145. Nevertheless, so far the breakdown of the wedge is not the DASH market under the control of sellers.