Hedera Hashgraph’s native token, $HBAR, has recorded a sharp upswing of nearly 15% over the past week, signaling strong short-term momentum in the market.
However, readings from its daily chart show that a key momentum indicator has formed a bearish divergence with $HBAR’s climbing price, raising concerns that the recent gains could be running out of steam.
Hedera’s $HBAR Climbs, But Weak Money Flows Threaten the Rally
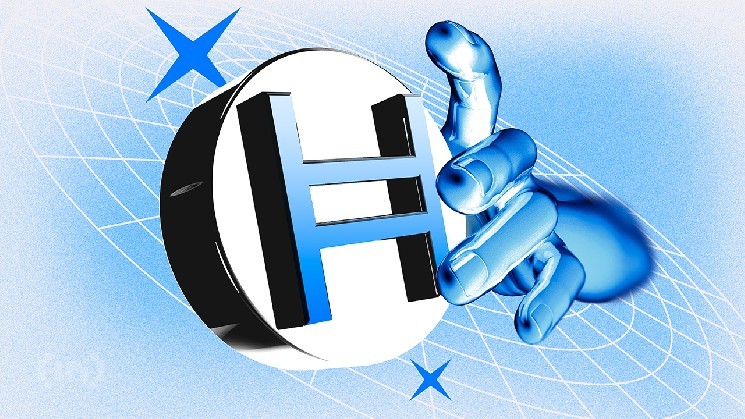
An assessment of the $HBAR/USD daily chart shows the Chaikin Money Flow (CMF) trending downward and slipping below the zero line. This comes even as $HBAR’s price has climbed nearly 15% over the past week.
For token TA and market updates: Want more token insights like this? Sign up for Editor Harsh Notariya’s Daily Crypto Newsletter here.
 $HBAR CMF. ">
The CMF indicator measures how money flows into and out of an asset. This disconnect between rising prices and weakening money flow points to a bearish divergence, indicating that the buying momentum is not fully backing the recent rally.
$HBAR’s falling CMF suggests that capital inflows are shrinking despite the price increase. This indicates weakening demand and raises the probability of a near-term pullback, as rallies without strong support are often unsustainable.
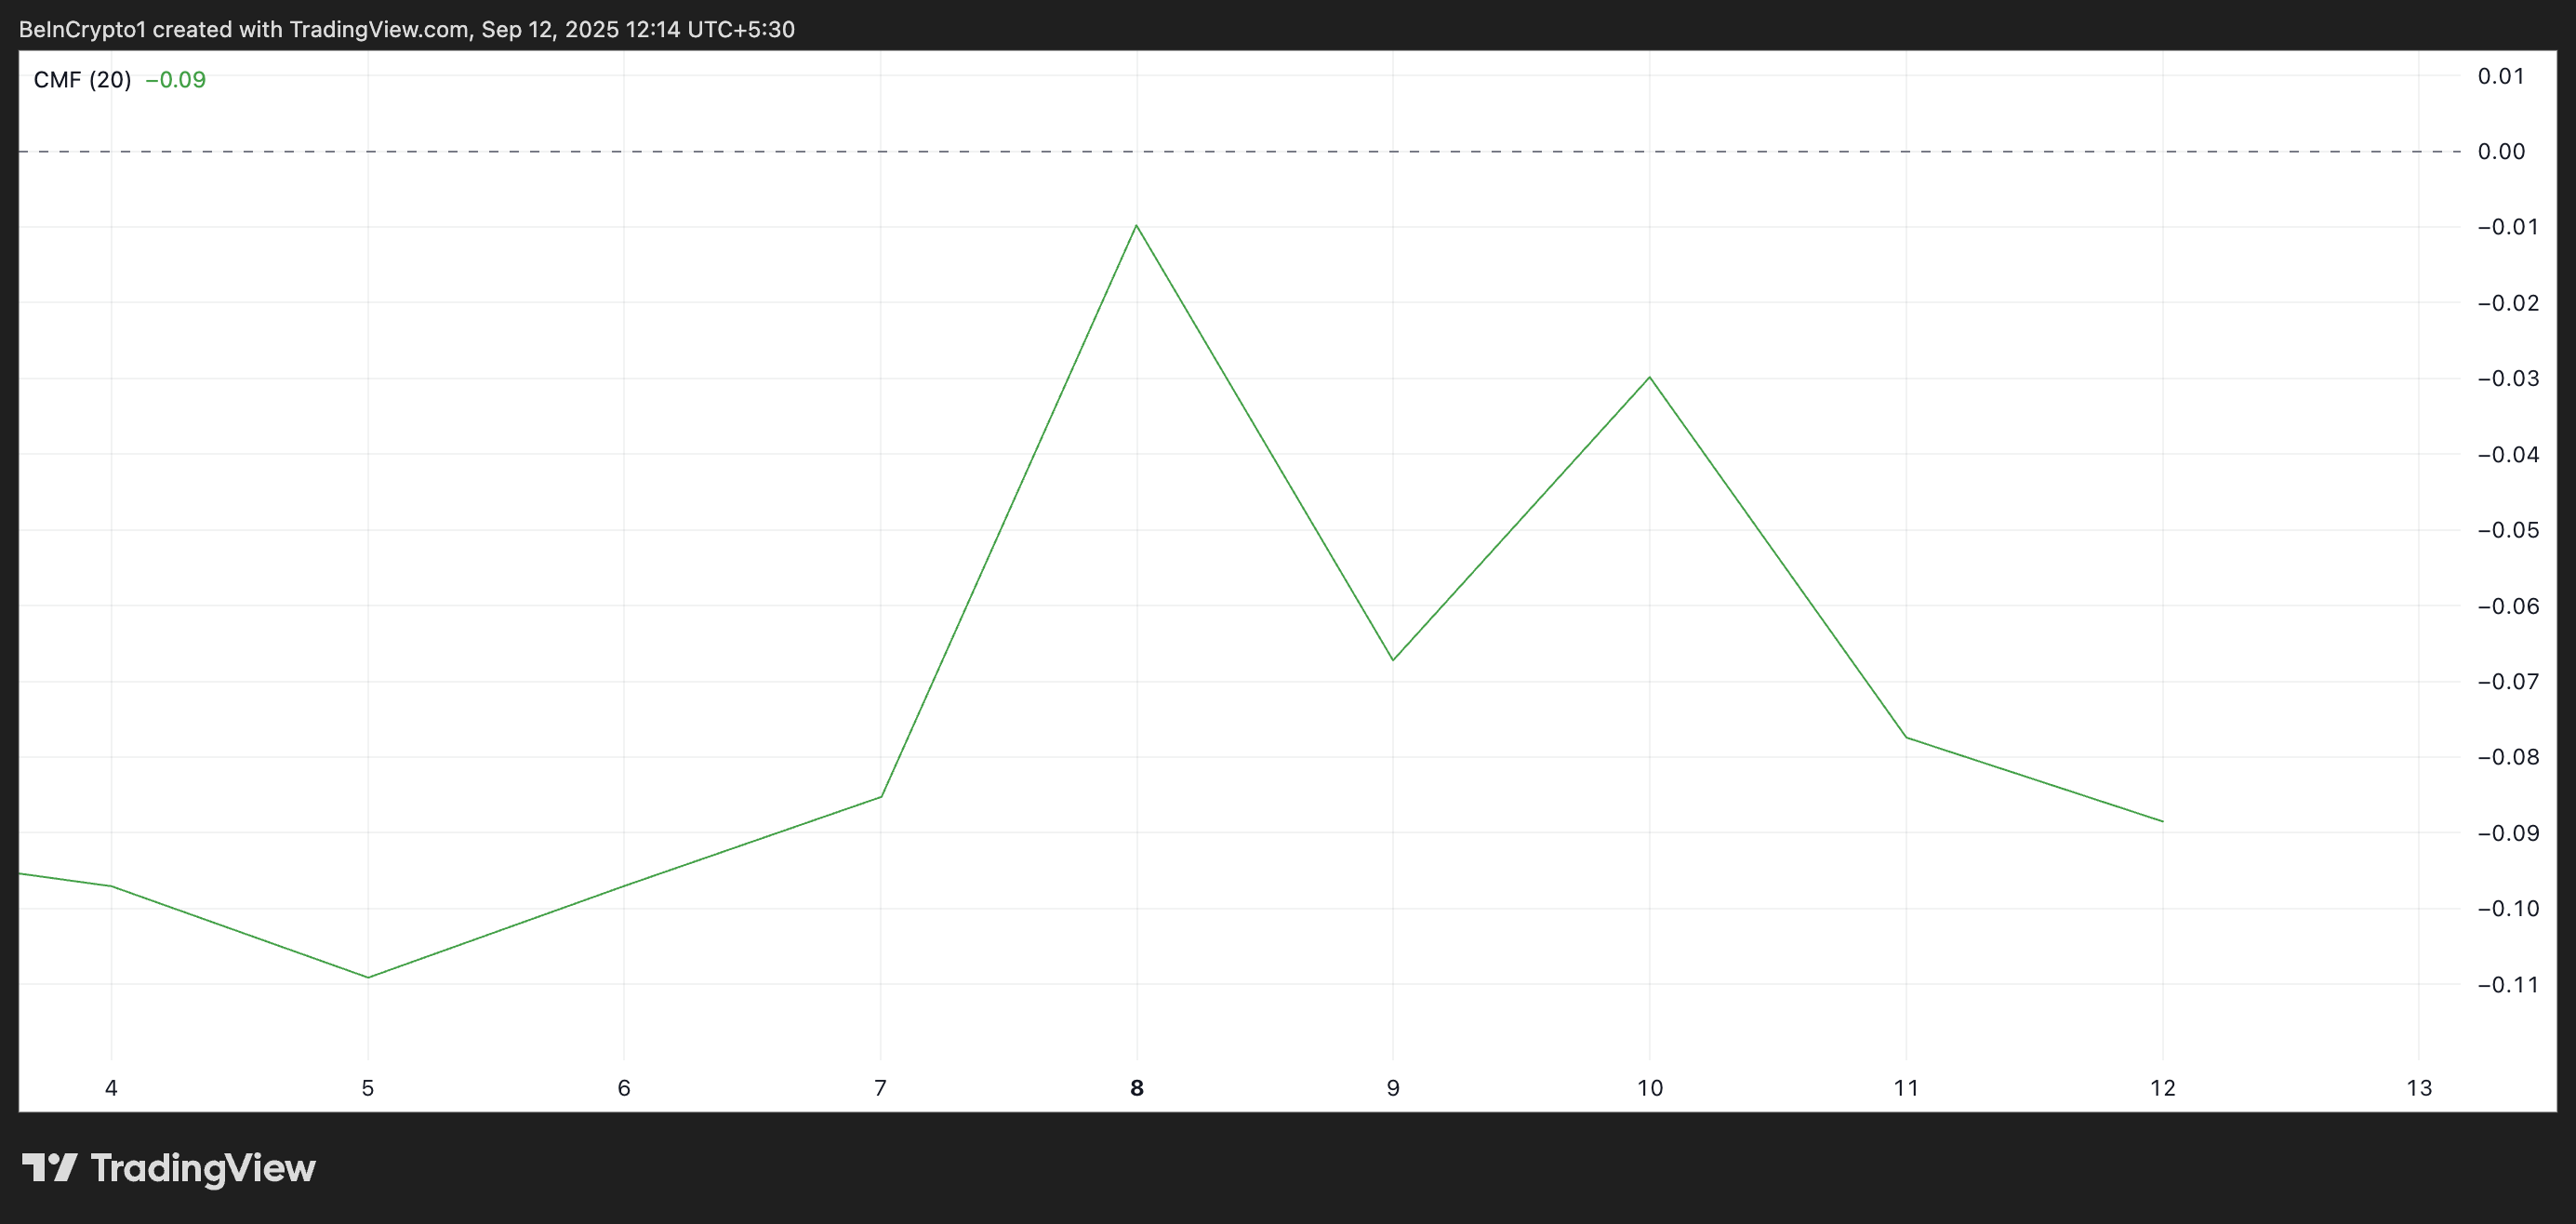
Furthermore, $HBAR continues to trade below its super trend indicator, adding to the bearish outlook. As of this writing, the super trend line forms dynamic resistance above the token’s price at $0.2527, indicating that sell-side pressure is still dominant.
 $HBAR Super Trend Indicator.">
This indicator tracks the direction and strength of an asset’s price trend. It is displayed as a line on the price chart, changing color to signify the trend: green for an uptrend and red for a downtrend.
When an asset’s price trades below its super trend indicator, selling pressure dominates the market. This could make it harder for $HBAR bulls to extend the current rally without a significant breakout.
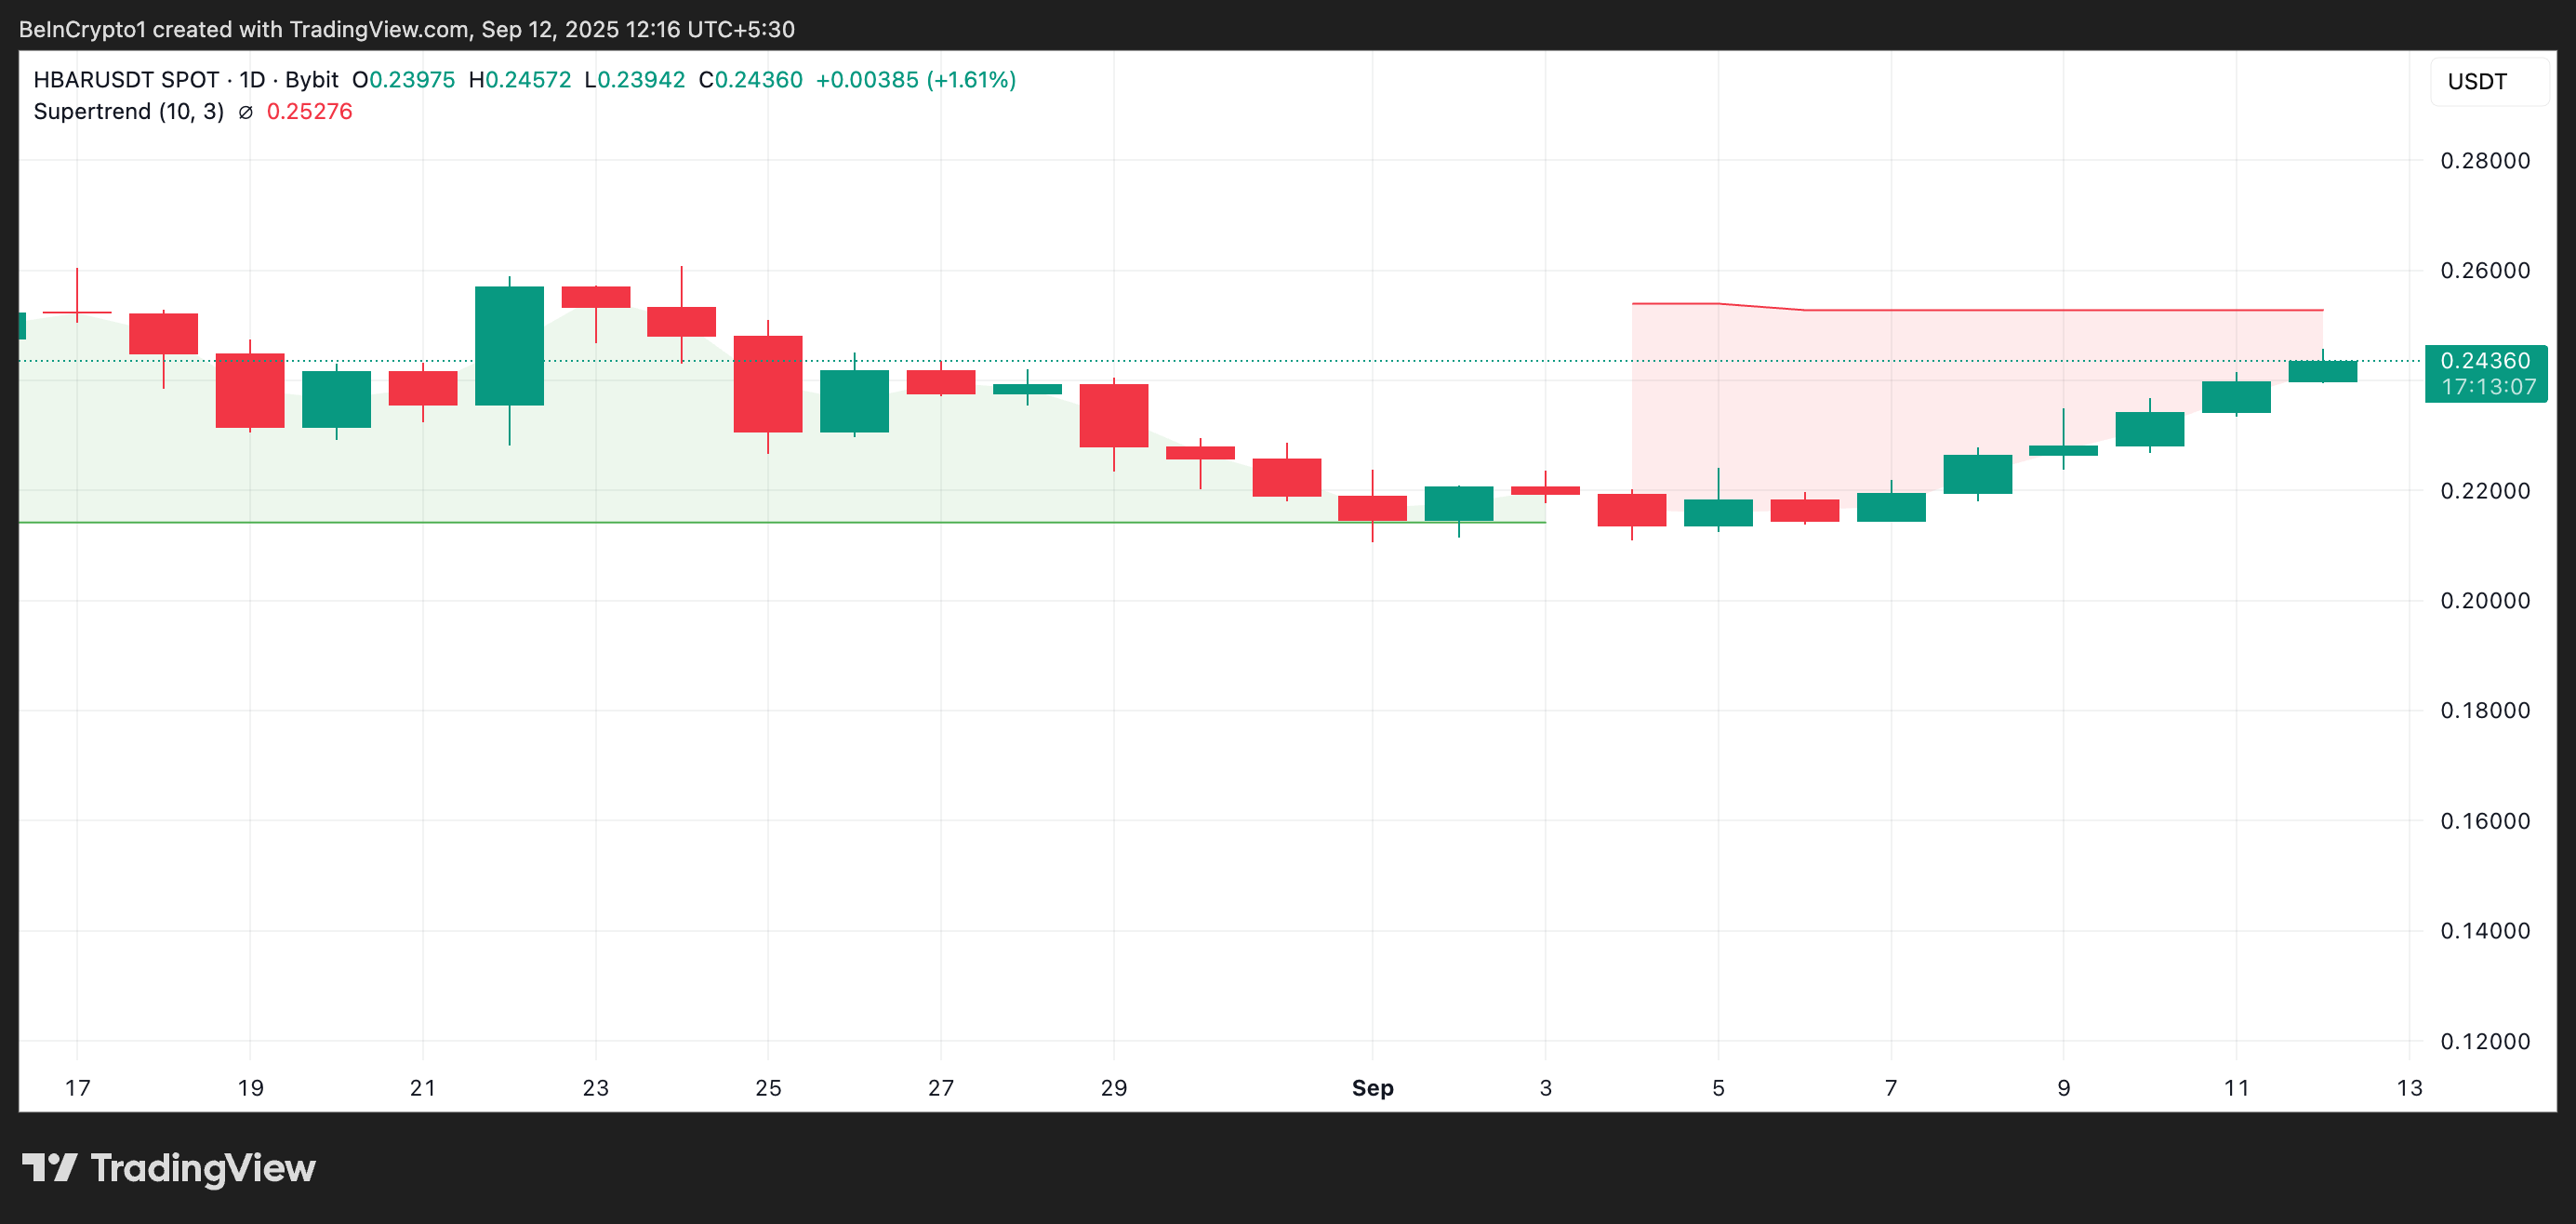
$HBAR Faces Crossroads: Support at $0.2368 or Breakout Above $0.2527?
Once buyer exhaustion sets in, $HBAR’s upward momentum could weaken, with a reversal toward the $0.2368 support level likely. A breakdown below this floor could open the way for a deeper decline to $0.2156.
 $HBAR Price Analysis">
Conversely, if fresh demand enters the market and sustains the rally, $HBAR could attempt to break above the dynamic resistance of its super trend indicator at $0.2527. A successful breakout would clear the path for further gains toward $0.2669.
The post Hedera’s $HBAR Climbs 15%, But Diverging Flows Suggest Bulls May Tire Soon appeared first on BeInCrypto.