
Worldcoin ($WLD) price sits at $1.85, up 45% in the past 24 hours and over 110% this week. Three-month gains now stand at 50%, lifting yearly returns by 26% after a long stretch of negative performance.
Such rapid gains rarely come without a pause. The signs suggest a pullback is imminent, but other signals point to it being a healthy breather rather than a trend reversal.
Profit-Taking Puts Pressure on the Rally
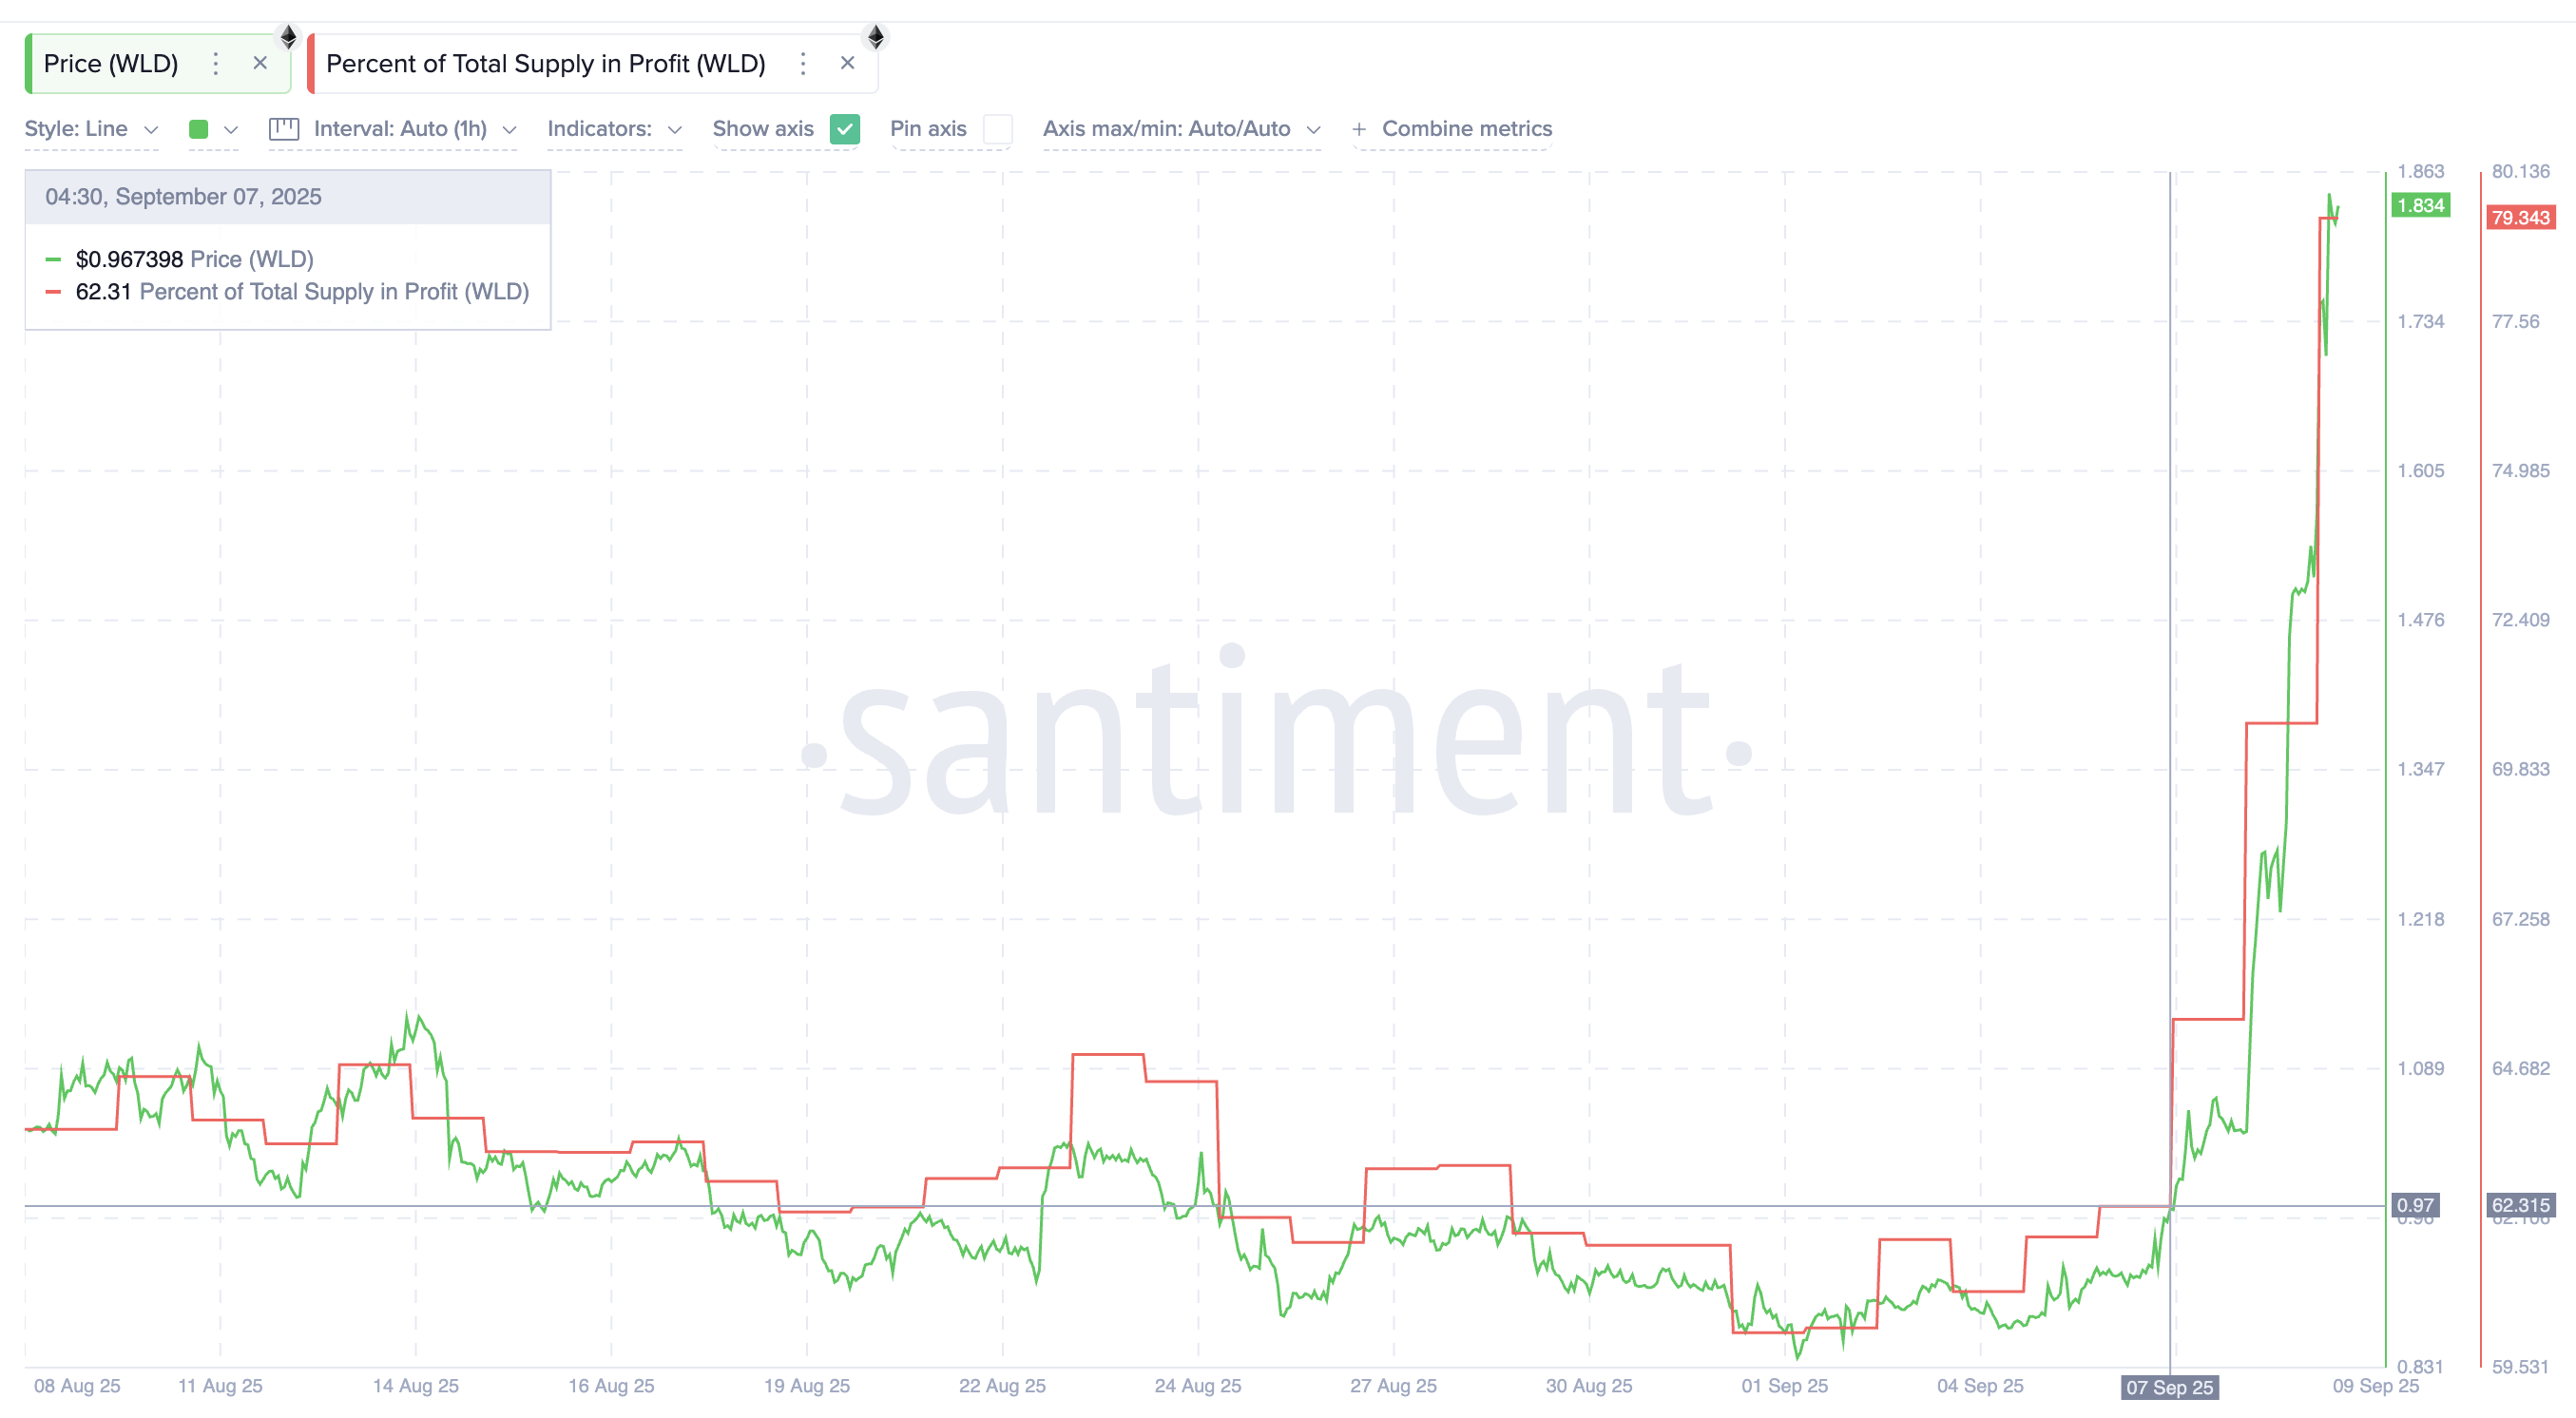
One red flag comes from the percentage of supply in profit. Between September 7 and 8, the share of $WLD in profit jumped from 62.3% to 79.3%. This means nearly 80% of holders are sitting on gains — a setup that usually invites profit-taking.
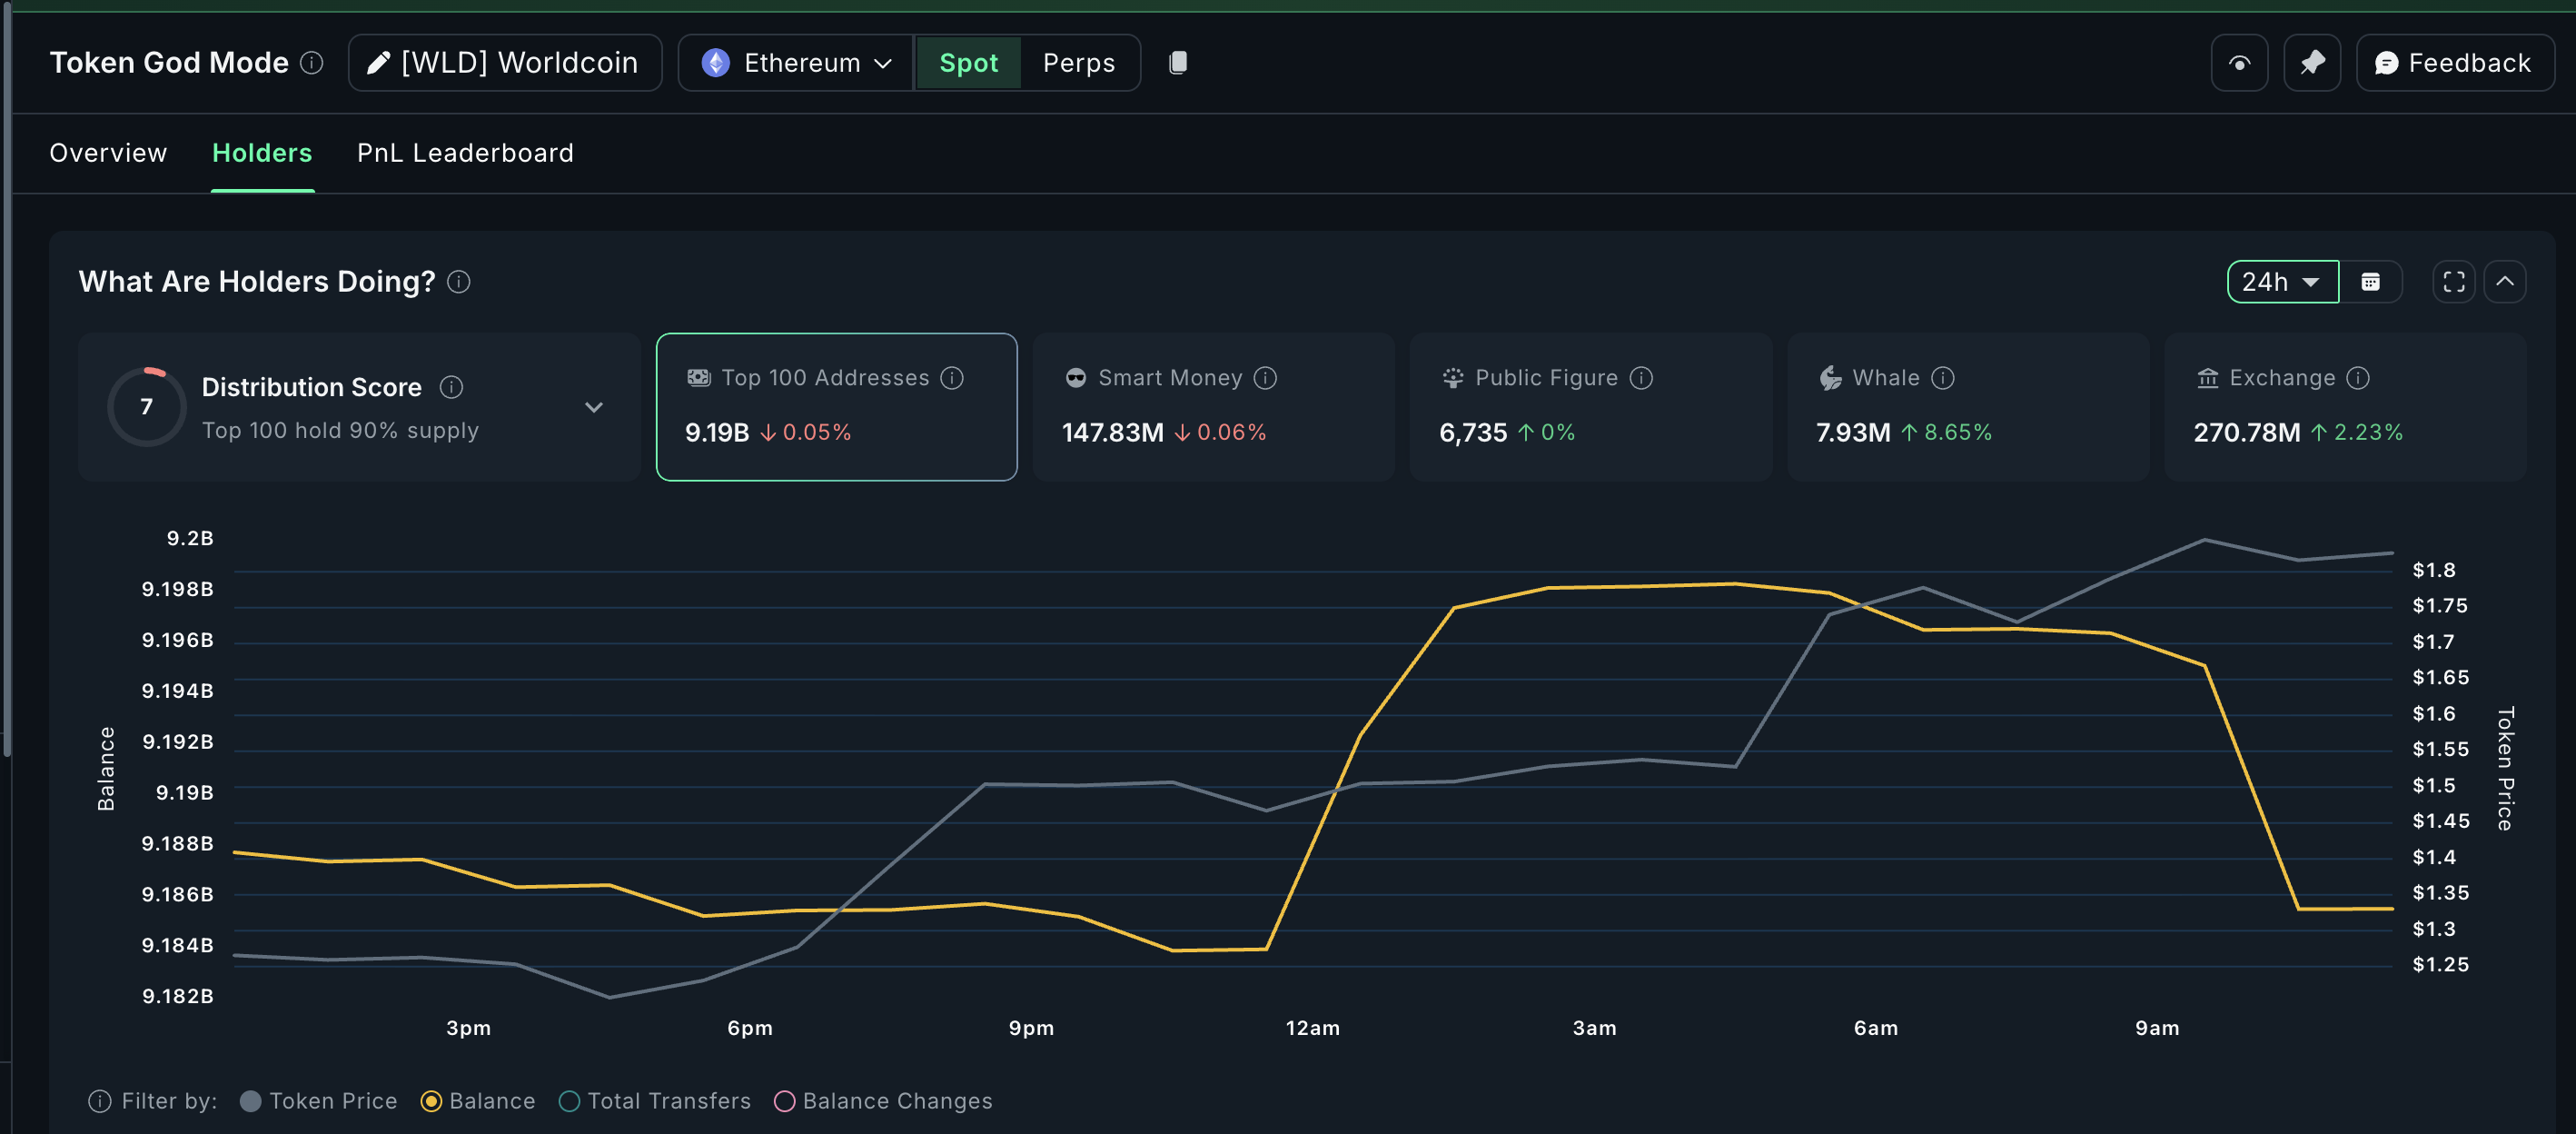
Exchange flows confirm this: retail and short-term wallets have sent tokens to exchanges, pushing exchange balances up by 2.23%. At $1.83 per token, that rise represents roughly $11 million in potential sell pressure.
 $WLD Supply In Profit Surges">
Meanwhile, whales have been adding. Their holdings climbed from 7.30 million to 7.93 million $WLD, a net increase worth about $1.15million.
When compared, the inflows to exchanges exceeded the whale accumulation, resulting in a net selling pressure of over $9.5 million. And that too without taking smart money and top 100 addresses into consideration, as both these cohorts have also dumped over the past 24 hours.
This imbalance explains why the $WLD price could stall in the short term.
Want more token insights like this? Sign up for Editor Harsh Notariya’s Daily Crypto Newsletter here.
 $WLD Buying Pressure Is Fading">
The Relative Strength Index (RSI) adds weight to this view. RSI, which measures whether an asset is overbought or oversold, is now the most overheated since early 2024. That makes a correction likely, though we’ll explore the RSI implications further in the price section below.
Dip Buying Shows Why This Could Be a Healthy Correction
Despite the selling pressure, demand is not absent. The Money Flow Index (MFI), which tracks whether inflows outweigh outflows, has surged to its highest level since early 2024. A rising MFI while price consolidates suggests that buyers — particularly whales — are absorbing every small dip.
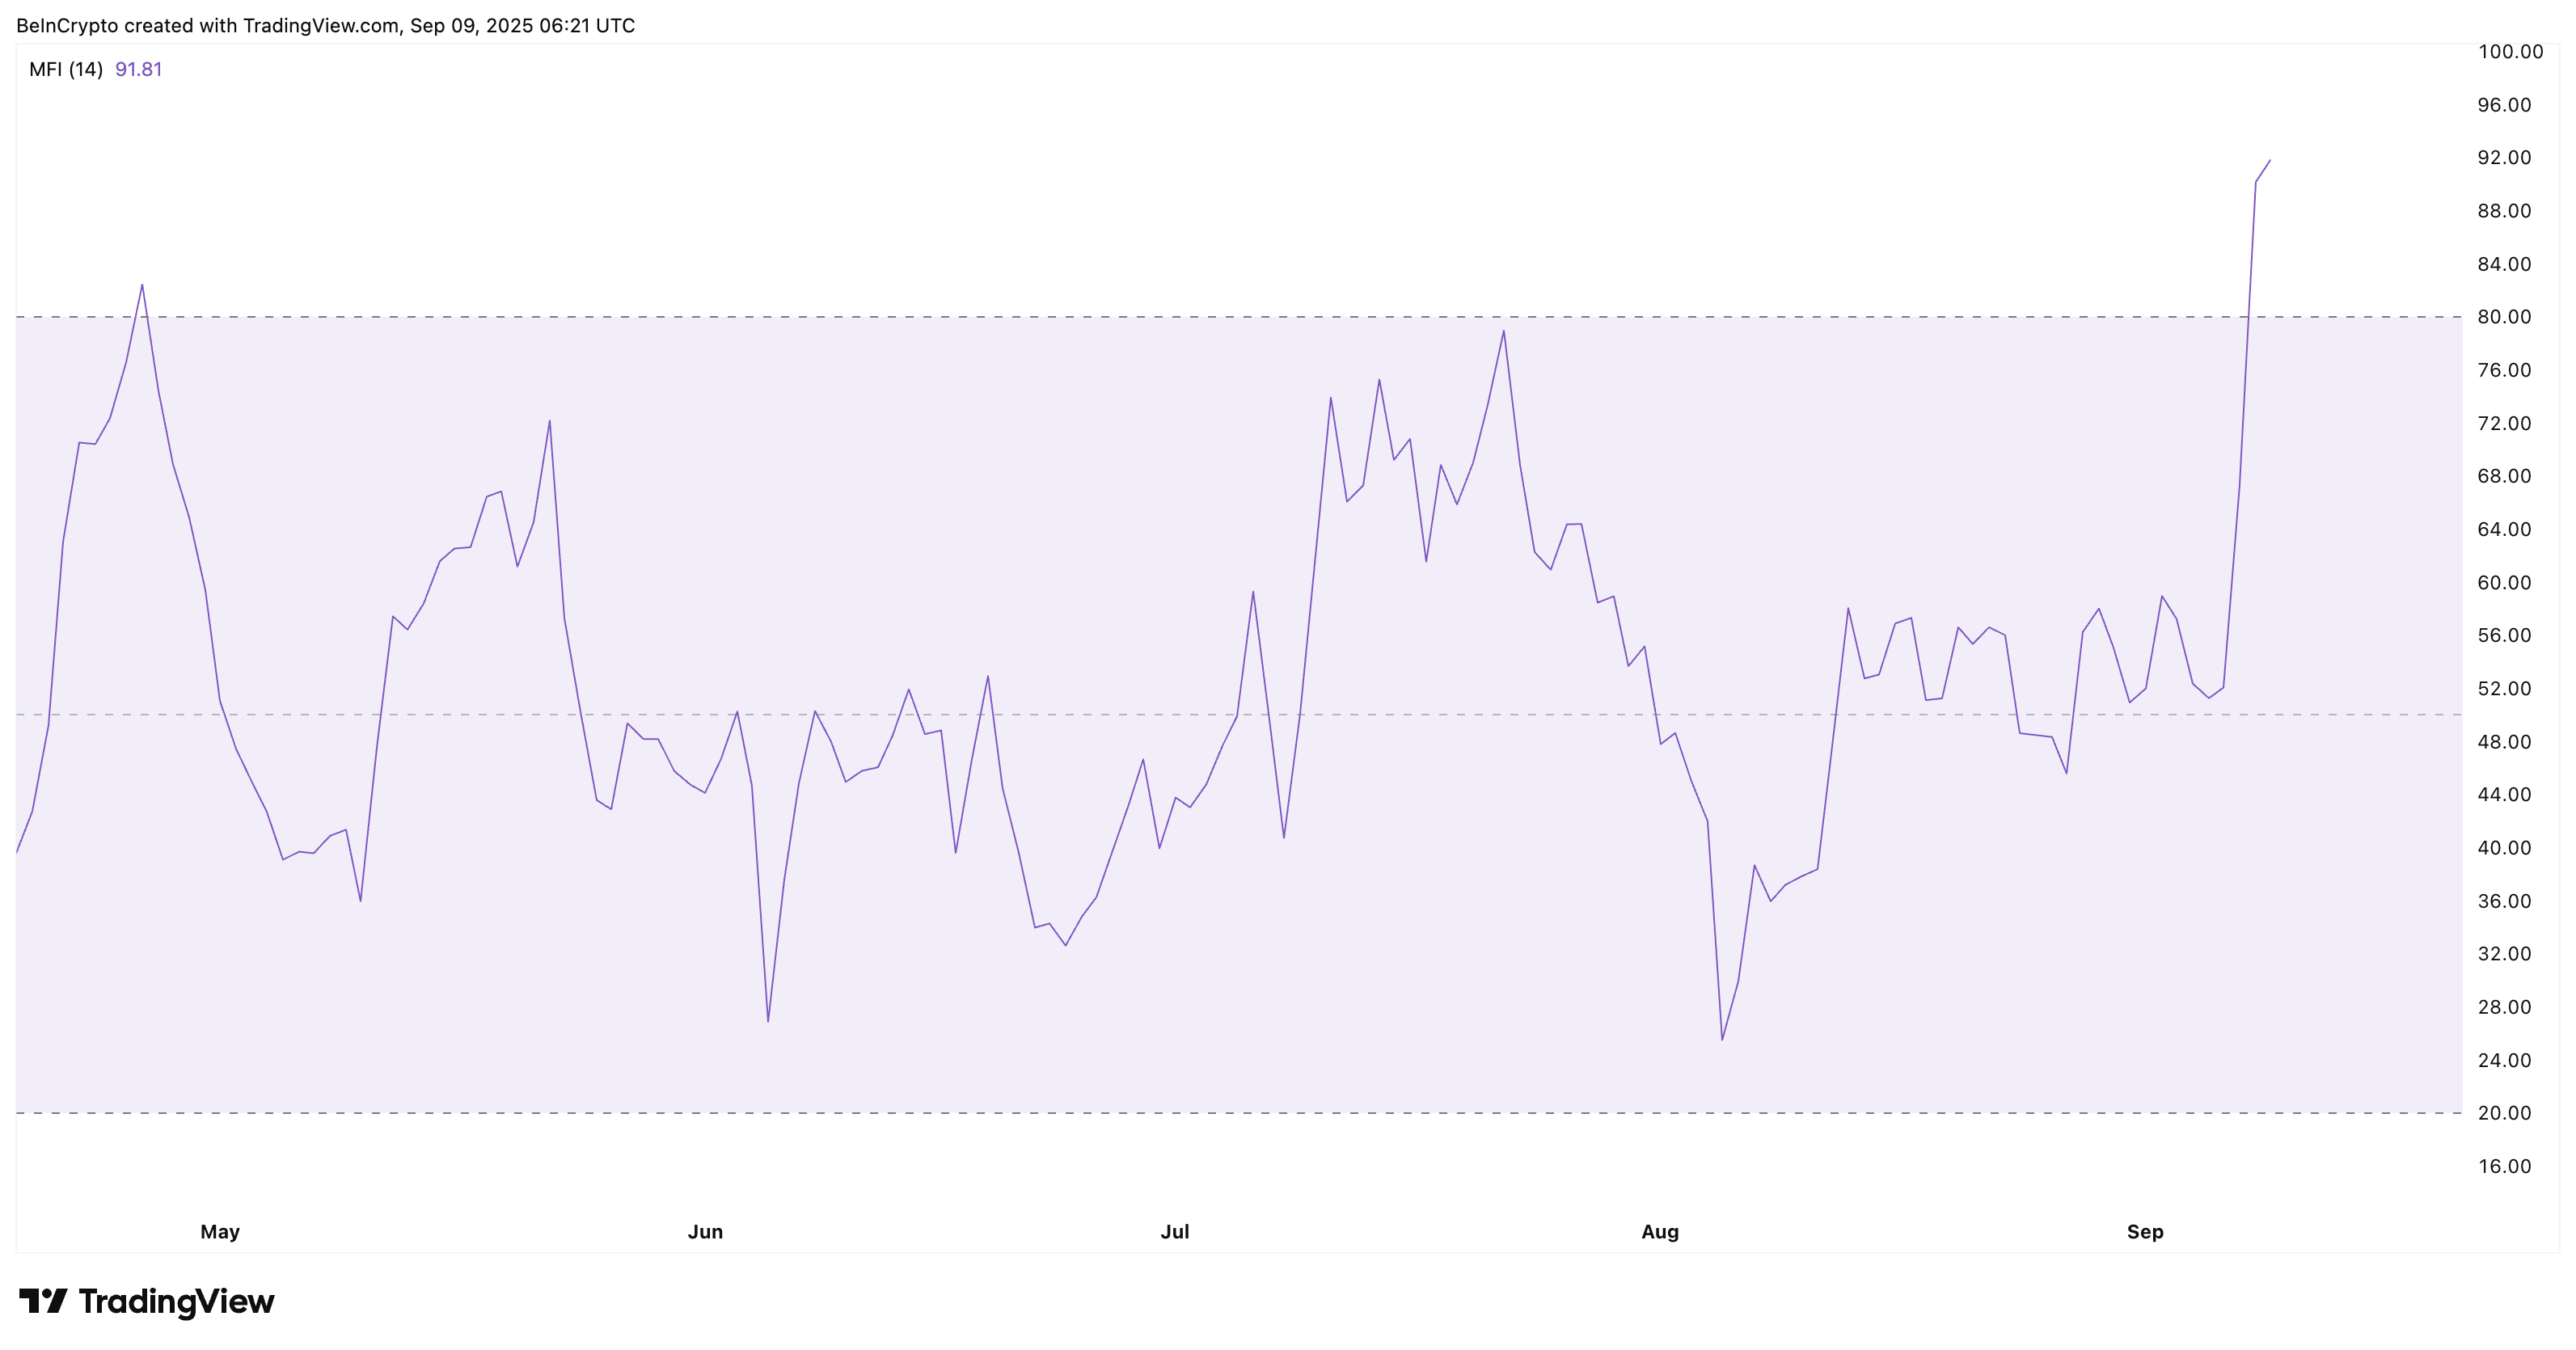
This is important because MFI strength often signals that corrections are shallow. When profit-taking sparks a pullback, dip buyers typically step in quickly to limit downside.
In $WLD’s case, this steady inflow means that even if the price cools after its unworldly rally, the correction may not deepen into a collapse. Instead, it looks more like a pause before testing higher levels.
$WLD Price Chart Validates a Healthy Pullback
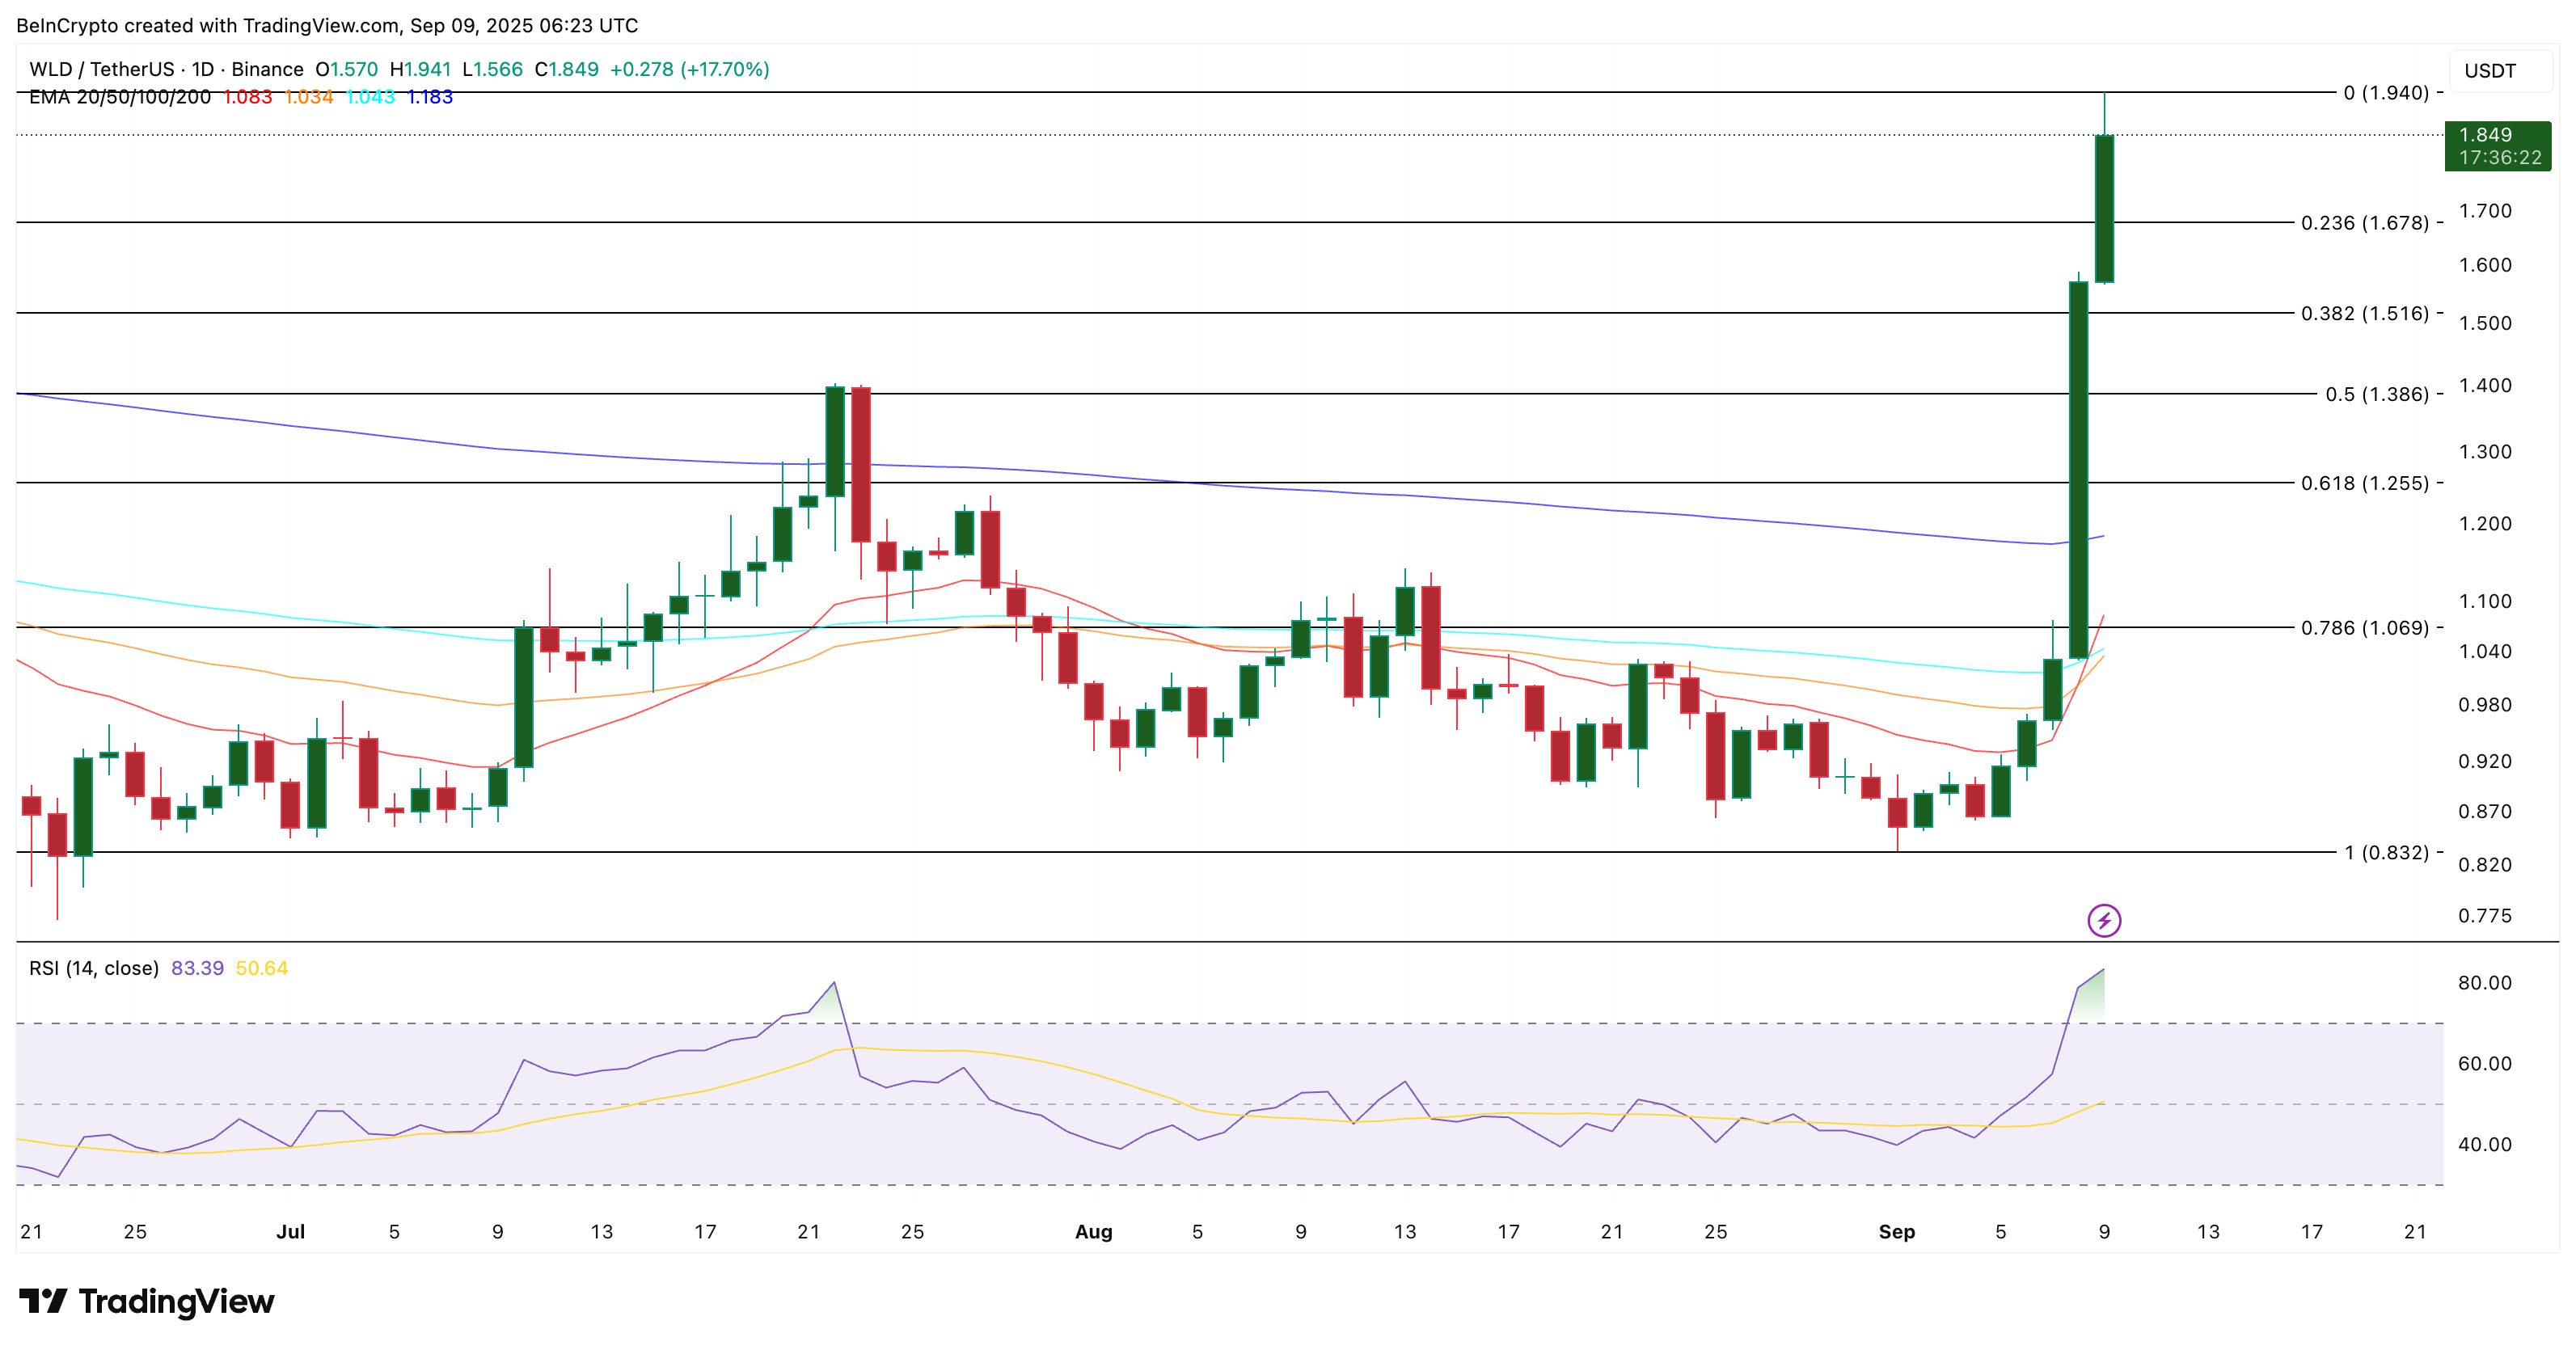
The $WLD price chart supports this balanced outlook. As noted earlier, RSI is stretched (in the overbought territory), confirming that a near-term dip is due. However, $WLD continues to trade in a bullish setup, as its moving averages are flashing strength.
 $WLD Price Analysis">
The 50-day Exponential Moving Average (EMA) or the orange line, which reacts faster to price changes, is closing in on the slower 100-day EMA (sky blue line). If the 50-day crosses above, it would form a “golden cross” — a signal often tied to extended bullish trends. Multiple golden crosses in past rallies have preceded days of upside, making this a key structure to watch.
The expectations of the bullish crossover forming during the pullback could add to the “healthy correction” narrative.
For levels, $1.38 remains the nearest strong support. If that breaks, the correction could deepen to $1.06. On the upside, a clean daily close above $1.94 would cancel the pullback scenario altogether, likely pushing the $WLD price toward fresh highs.
The post World’s ( $WLD) Unworldly Price Rally Risks A Pullback, Here Is Why It Could Be A Healthy One appeared first on BeInCrypto.