
$XRP traded at $3.24 as of Aug. 13, 2025, reflecting a 1.8% intraday increase. The asset maintained a daily range between $3.20 and $3.32, with a 24-hour trading volume of $9.64 billion and a total market capitalization of $193.41 billion.
$XRP
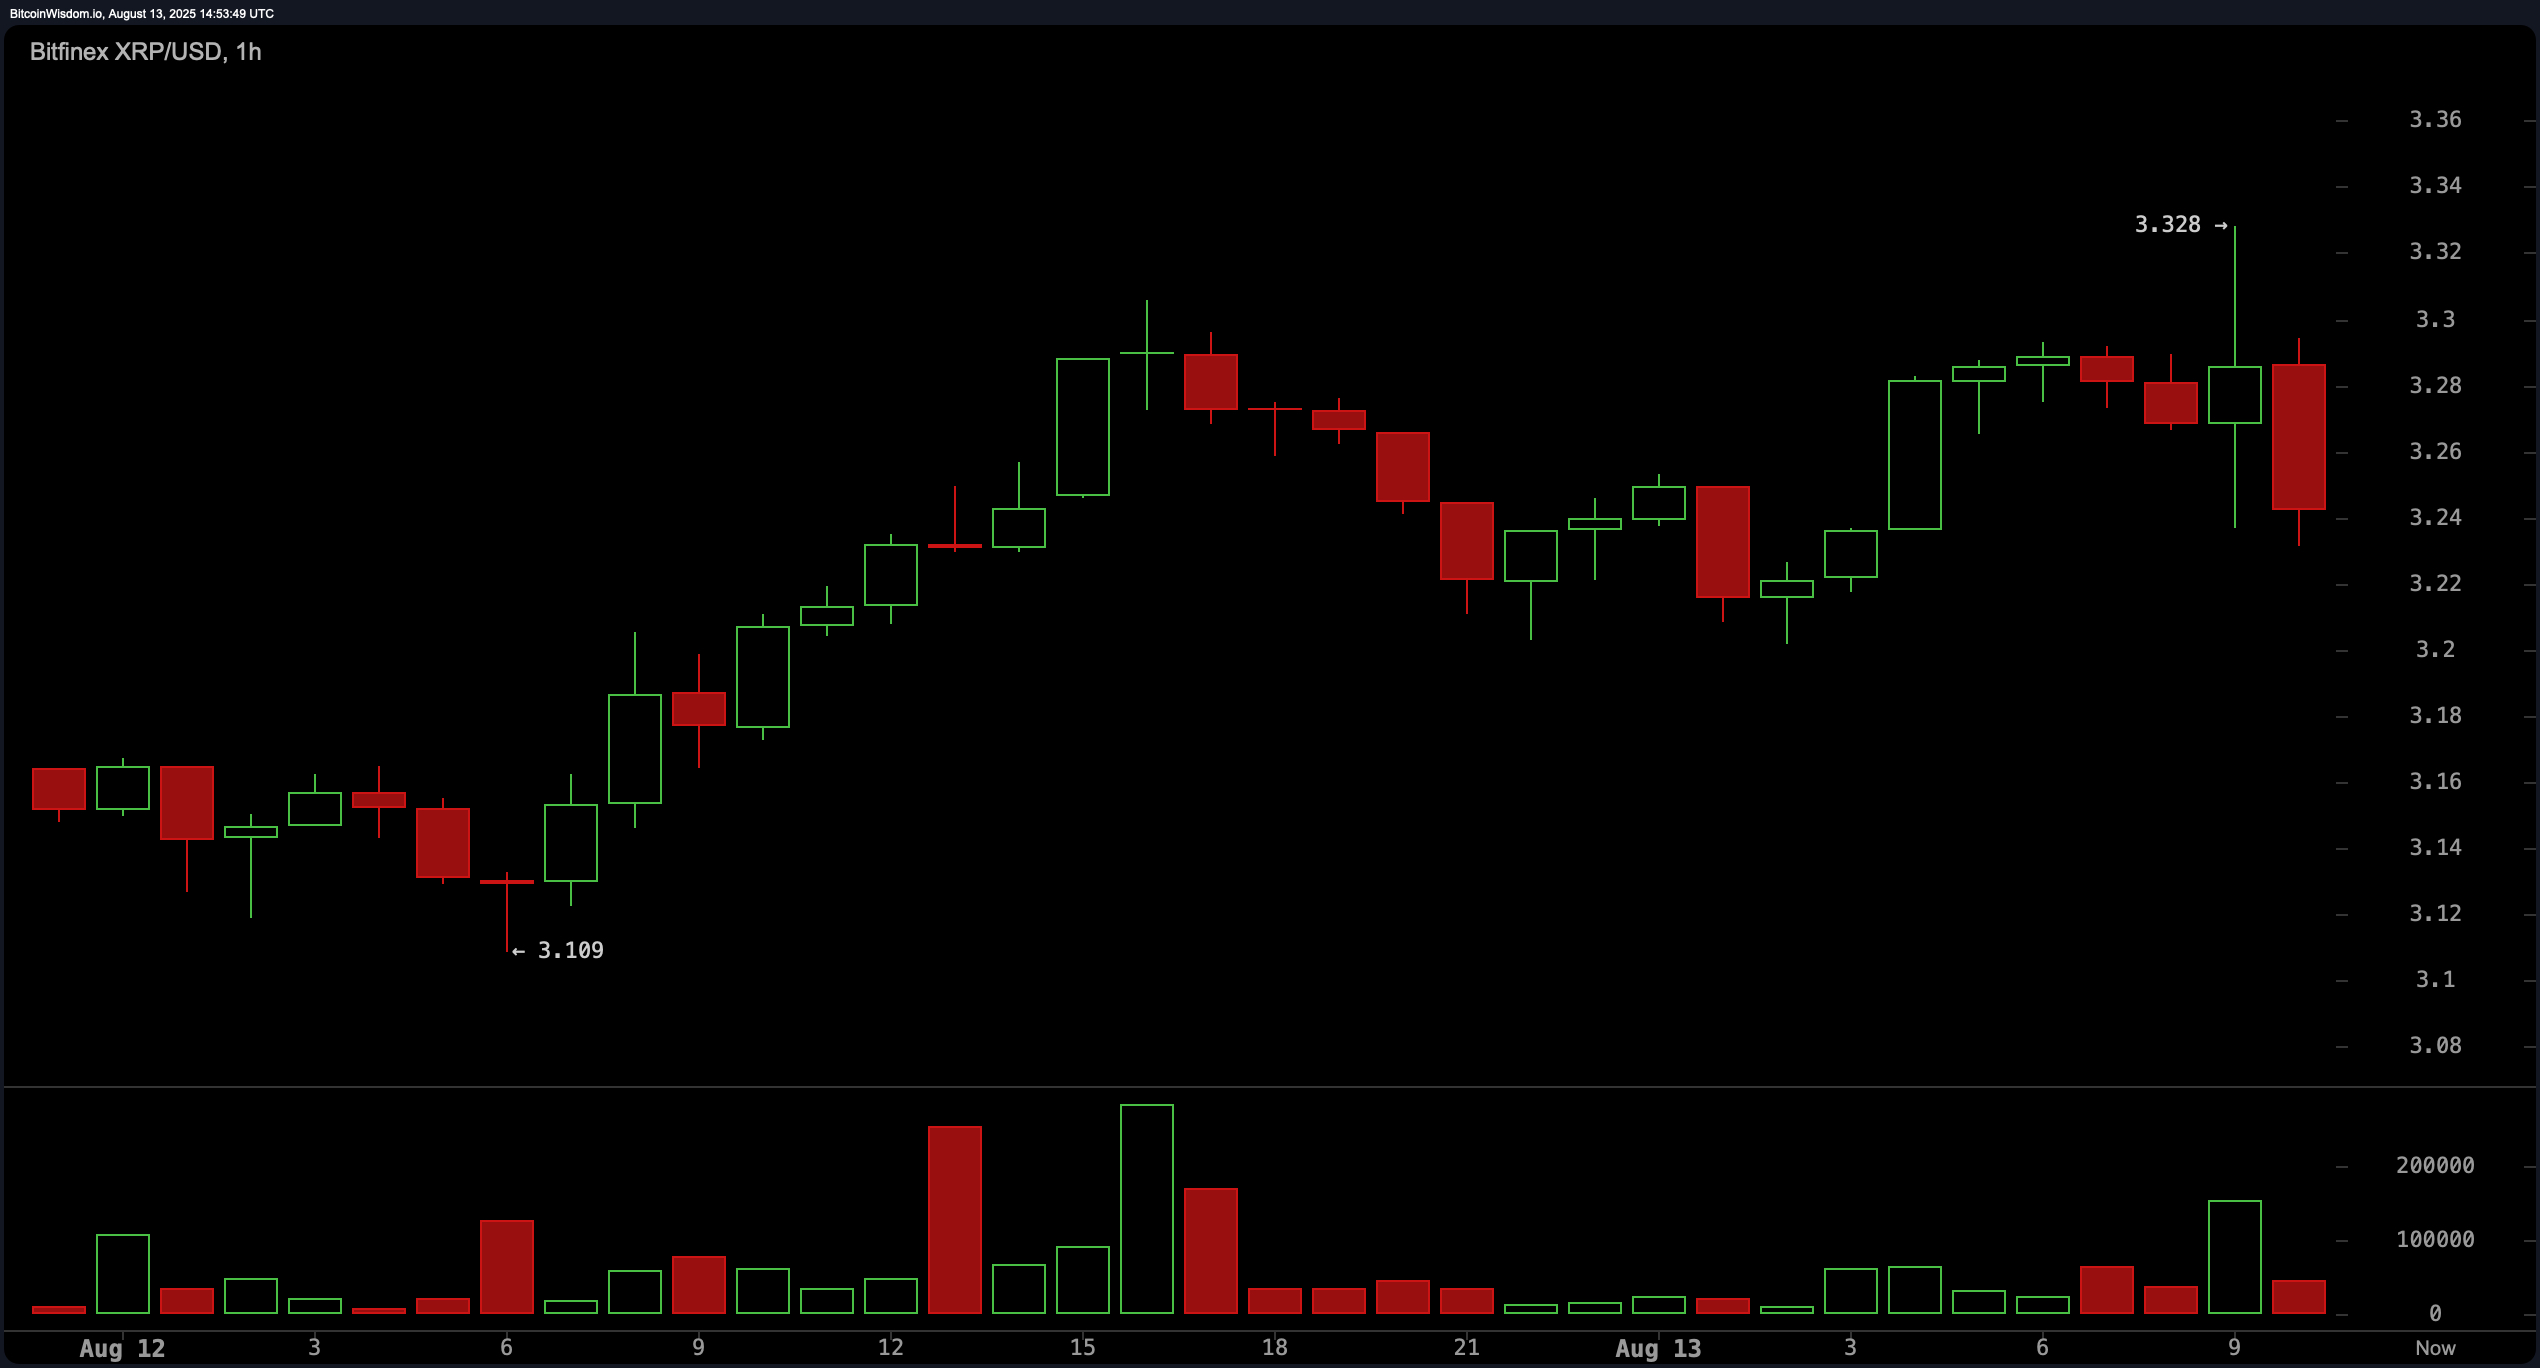
On the 1-hour chart, $XRP experienced a modest retracement following a peak at $3.32. The sharp upper wick on the hourly candle at this level, paired with a corresponding spike in red volume, indicated immediate selling pressure. Support was identified at $3.22, with potential for further retracement toward $3.18. While momentum appears temporarily exhausted, bullish continuation is possible only if $XRP convincingly breaks above the $3.32 resistance.
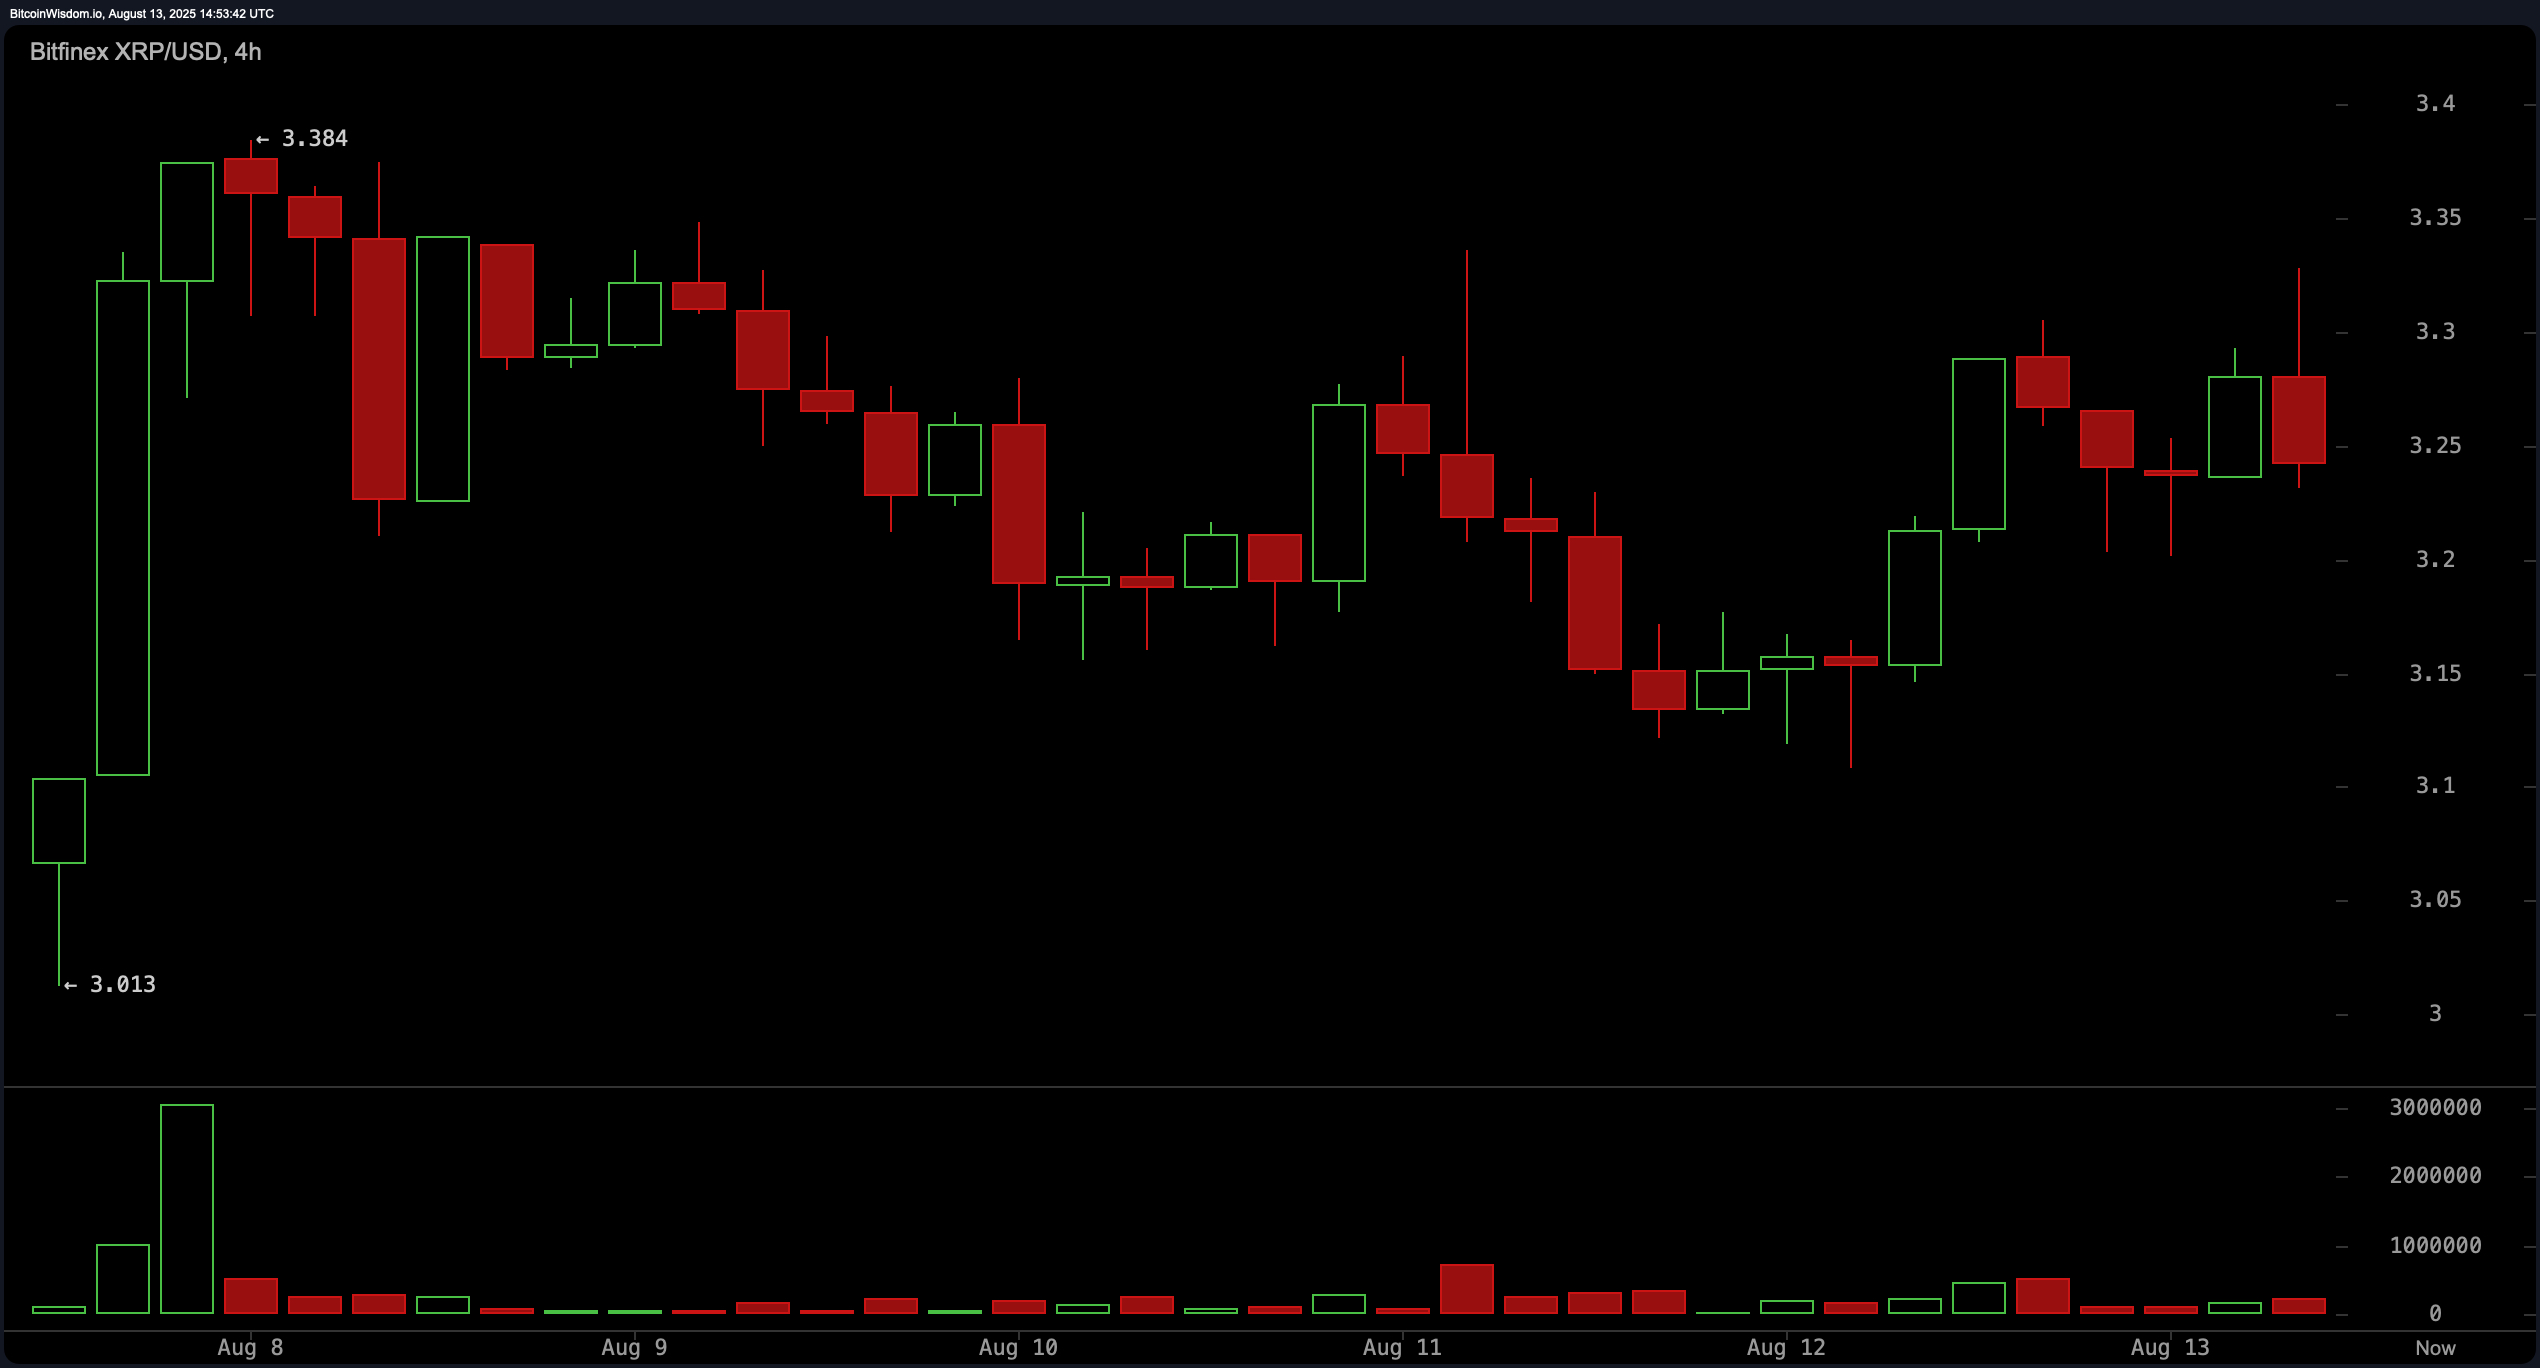
Zooming out to the 4-hour chart, $XRP’s short-term price action displays a pattern of recovery from a recent downtrend. A bounce from the $3.01 area was followed by the formation of an ascending triangle pattern, bounded between $3.15 and $3.30. Multiple attempts to surpass the $3.30 level have failed, indicating a key resistance zone. A confirmed breakout above this threshold would likely signal bullish continuation, whereas a breakdown below $3.15 could suggest another test of the $3.00 support.
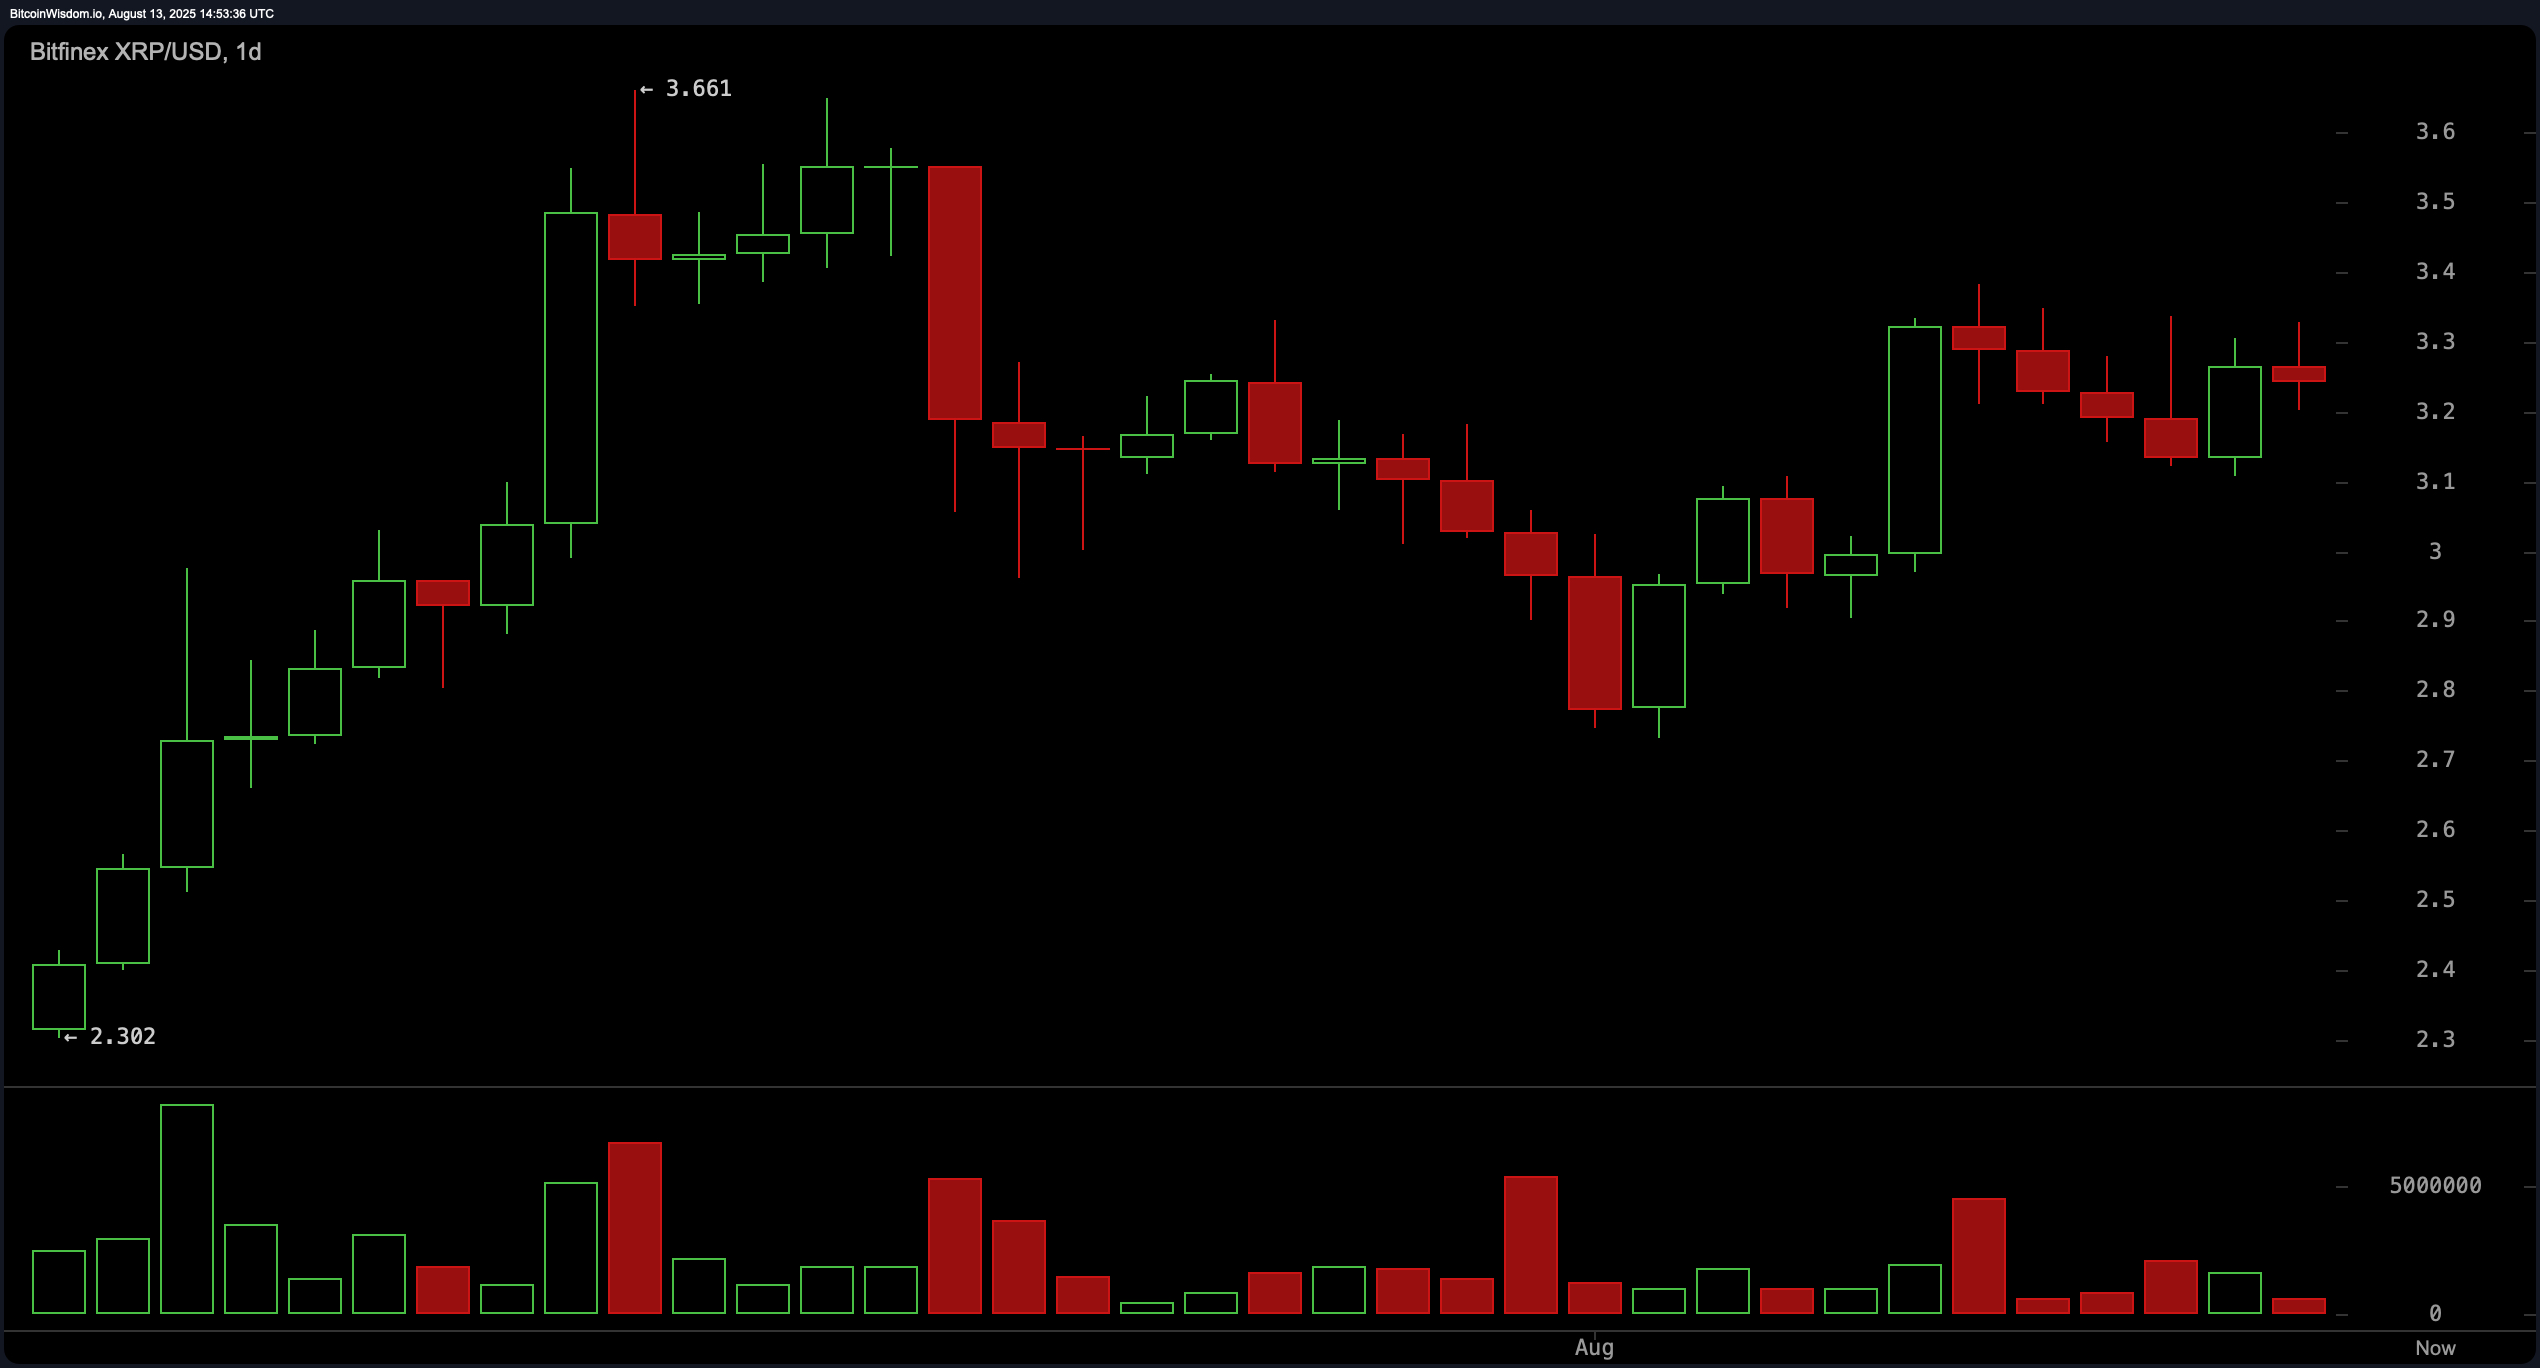
The daily chart reflects a broader neutral to slightly bullish trend. $XRP had rallied as high as $3.66 before encountering a correction, followed by signs of gradual accumulation. Currently, the price is establishing higher lows, pointing to underlying strength, though fading volume on the rebound cautions against premature optimism. Critical resistance lies between $3.30 and $3.40, and a breakout with strong volume could reignite bullish momentum. A drop below $2.90, however, would invalidate the trend and reintroduce bearish pressure.
Oscillator readings on Wednesday were predominantly neutral. The relative strength index (RSI) registered at 57.67, the Stochastic oscillator at 74.80, and the commodity channel index (CCI) at 92.70 — all indicating equilibrium. The average directional index (ADX) at 30.62 on the daily chart pointed to a trend of moderate strength without a clear directional bias. However, two key indicators signal a weakness: the momentum oscillator reads 0.30622 and issues a bearish signal, while the moving average convergence divergence (MACD) level at 0.08283 also shows a negative signal.
All moving averages provided strong support for the uptrend. The exponential moving averages (EMA) and simple moving averages (SMA) across 10, 20, 30, 50, 100, and 200 periods — including EMA (10) at $3.18002, SMA (10) at $3.16980, and EMA (200) at $2.41450 — all issued bullish signals. These technical indicators reinforce the uplifting structure, particularly the long-term averages, which show firm upward alignment. The price remaining above these key averages supports the broader thesis of continued strength, contingent on volume confirmation above resistance.
Bull Verdict:
If $XRP breaks decisively above the $3.32 resistance with strong volume, the technical outlook turns firmly bullish. In that case, the asset could aim for a breakout toward the $3.40–$3.45 zone, with broader continuation likely given strong moving average support across all timeframes.
Bear Verdict:
Failure to hold above $3.15 or a break below the $3.10 stop-loss threshold would invalidate the higher-low structure. In such a scenario, bearish momentum could push $XRP back toward $3.00 or lower, especially if sell volume accelerates and oscillators continue to deteriorate.