
- $SUI defended the 0.786 Fib zone with a clean rebound, maintaining higher lows on weekly charts and preserving its bullish market structure.
- The symmetrical triangle pattern narrows, with breakout potential above $3.50 targeting $4.01, $4.96, $6.04, and $7.01.
- Elliott Wave analysis points to wave (3) expansion, with Fibonacci targets extending toward $11.85 if bullish momentum sustains.
$SUI has bounced and is holding a bullish structure within a tightening triangle. Traders now anticipate a breakout that could ignite a powerful rally toward multi-month highs and beyond.
Bulls Hold the Line at Trendline Support
According to Marcus Corvinus, $SUI snapped back “sharp, clean and confident” from the 0.786 Fibonacci retracement.Price is respecting an ascending trendline between $2.20 and $2.60, a zone tested multiple times since September 2024. Despite weeks of selling pressure, the higher-low structure remains intact.
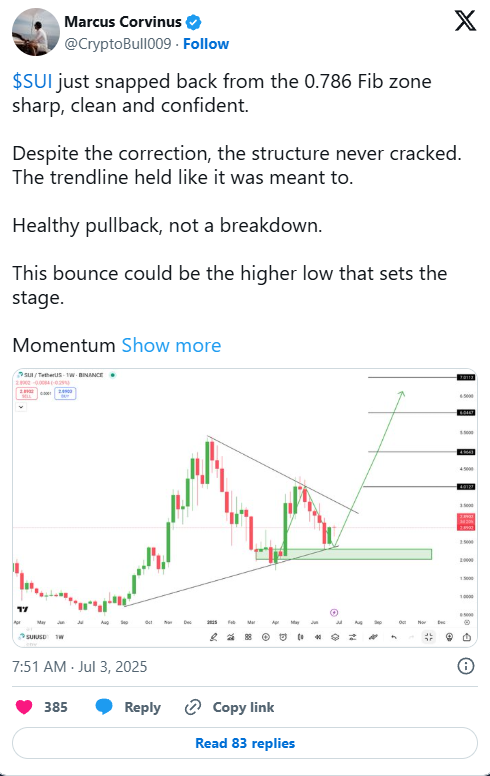
$SUI just snapped back from the 0.786 Fib zone sharp, clean and confident.
— Marcus Corvinus (@CryptoBull009) July 3, 2025
Despite the correction, the structure never cracked. The trendline held like it was meant to.
Healthy pullback, not a breakdown.
This bounce could be the higher low that sets the stage.
Momentum… pic.twitter.com/AWkO4SKscJ
The asset continues to consolidate inside a symmetrical triangle formed after the December 2024 peak near $6.90. Resistance caps rallies near $3.80–$4.00, while support has repeatedly attracted buyers. Current price trades near $2.89, mid-range between key support and resistance.
Compression Builds Toward a Breakout
A breakout above $3.50 could send targets to $4.5 and above based on historical rallies and Fibonacci projections. Failure to hold above $2.20 would invalidate the bullish structure.
Elliott Wave counts from More Crypto Online place the asset in wave (3) of a larger impulsive cycle, with Fibonacci extensions projecting $7.16, $8.17, and $11.85. The recent move above the 61.8% retracement at $2.4355 adds confluence to the bullish case.
Historical Retests Fuel Optimism
Analyst Lau highlights that past retests of $SUI’s long-term trendline have delivered triple-digit gains — 1,058% in 2024 and 122% in March 2025. The current retest could pave the way toward $7.00, echoing prior expansion phases.
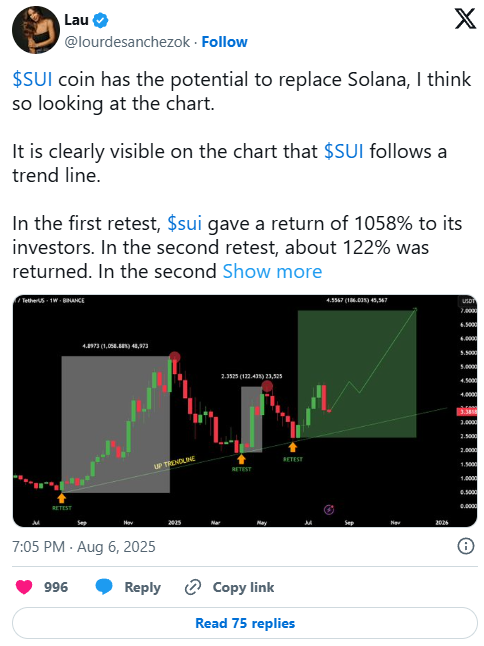
$SUI coin has the potential to replace Solana, I think so looking at the chart.
— Lau (@lourdesanchezok) August 6, 2025
It is clearly visible on the chart that $SUI follows a trend line.
In the first retest, $sui gave a return of 1058% to its investors. In the second retest, about 122% was returned. In the second… pic.twitter.com/AV1TTZcaUj
Momentum indicators show short-term cooling, with RSI near 53.82 and MACD turning softer after recent highs. However, the structure still points to price compression before a decisive move.