$XRP price indicators analysis
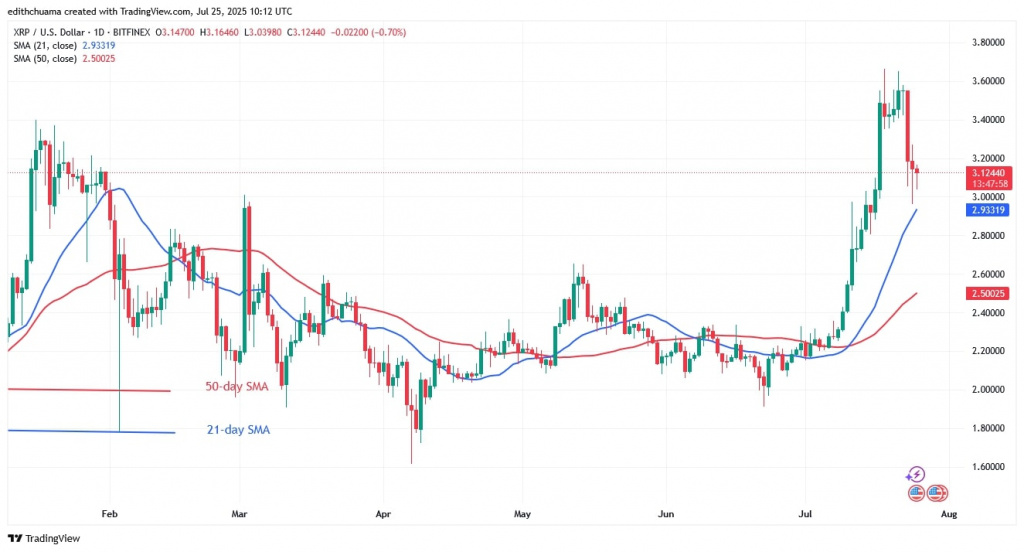
The horizontal moving average lines are pointing upwards, signalling an uptrend. Given the recent price decline, the price bars on the 4-hour chart are below the moving average lines. The price action is characterised by doji candlesticks that have forced the altcoin to stay within a limited range.
Technical indicators:
Key Resistance Levels – $2.80 and $3.00
Key Support Levels – $1.80 and $1.60
What is the next move for $XRP?
$XRP is currently in a sideways trend below its high of $3.60. The 4-hour chart shows that $XRP is trading above the $3.00 support but below the $3.60 barrier. The altcoin is trading above the $3.00 support level after being rejected twice at its recent peak. If the current support level holds, $XRP will restart its upward trend.
Meanwhile, the cryptocurrency signal is good, with the price remaining above the moving average lines.
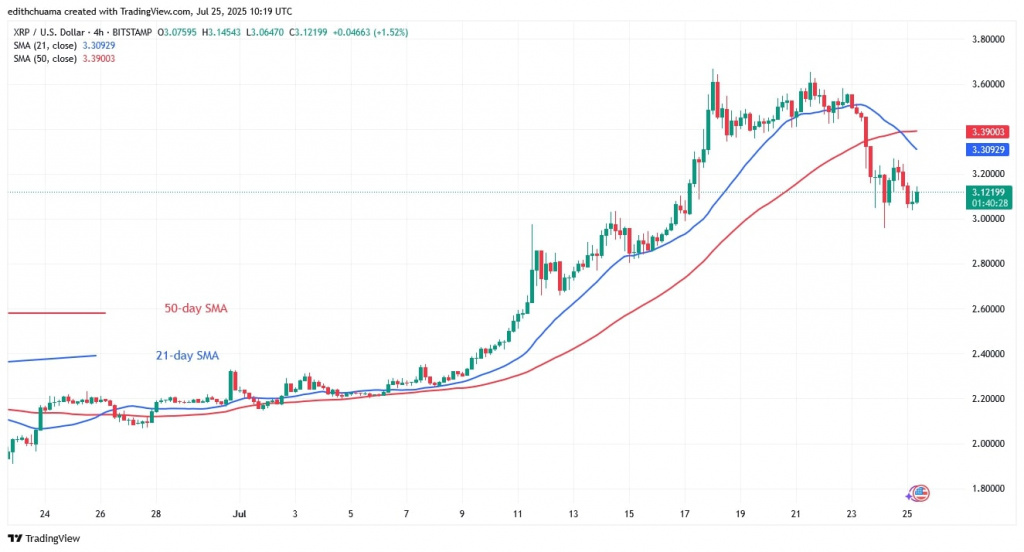
The price of $XRP reached a new high of $3.66, but pulled back again, as reported by Coinidol.com on July 20.
Disclaimer. This analysis and forecast are the personal opinions of the author. They are not a recommendation to buy or sell cryptocurrency and should not be viewed as an endorsement by CoinIdol.com. Readers should do their research before investing in funds.

 coinidol.com