
- Bitcoin price nears its upper band of consolidation at $120,000 on Wednesday, inching closer to its all-time high of $123,218.
- Ethereum price remains stable above its daily support level at $3,730, with bulls targeting the $4,000 mark.
- Ripple’s XRP rebounds after retesting its key support at $3.40, nearing its record high.
Bitcoin (BTC) and Ripple (XRP) are nearing their respective all-time highs, while Ethereum (ETH) continues its steady climb toward the key $4,000 level. These top 3 cryptocurrencies by market capitalization are showing signs of renewed bullish momentum, supported by strong technical structures and rising investor interest.
Bitcoin could head toward record high above $120,000
Bitcoin price has been trading broadly sideways between $116,000 and $120,000 after reaching a new all-time high of $123,218 on July 14. At the time of writing on Wednesday, it trades near its upper consolidation band at $120,000.
If BTC closes above the upper boundary of the consolidation range at $120,000 on a daily basis, it could extend the recovery toward the fresh all-time high at $123,218.
The Relative Strength Index (RSI) on the daily chart reads 65, still below its overbought levels of 70, indicating bullish momentum. The Moving Average Convergence Divergence (MACD) indicator coils against each other, indicating indecisiveness among traders. For the bullish momentum to be sustained, the MACD must crossover to a bullish signal.
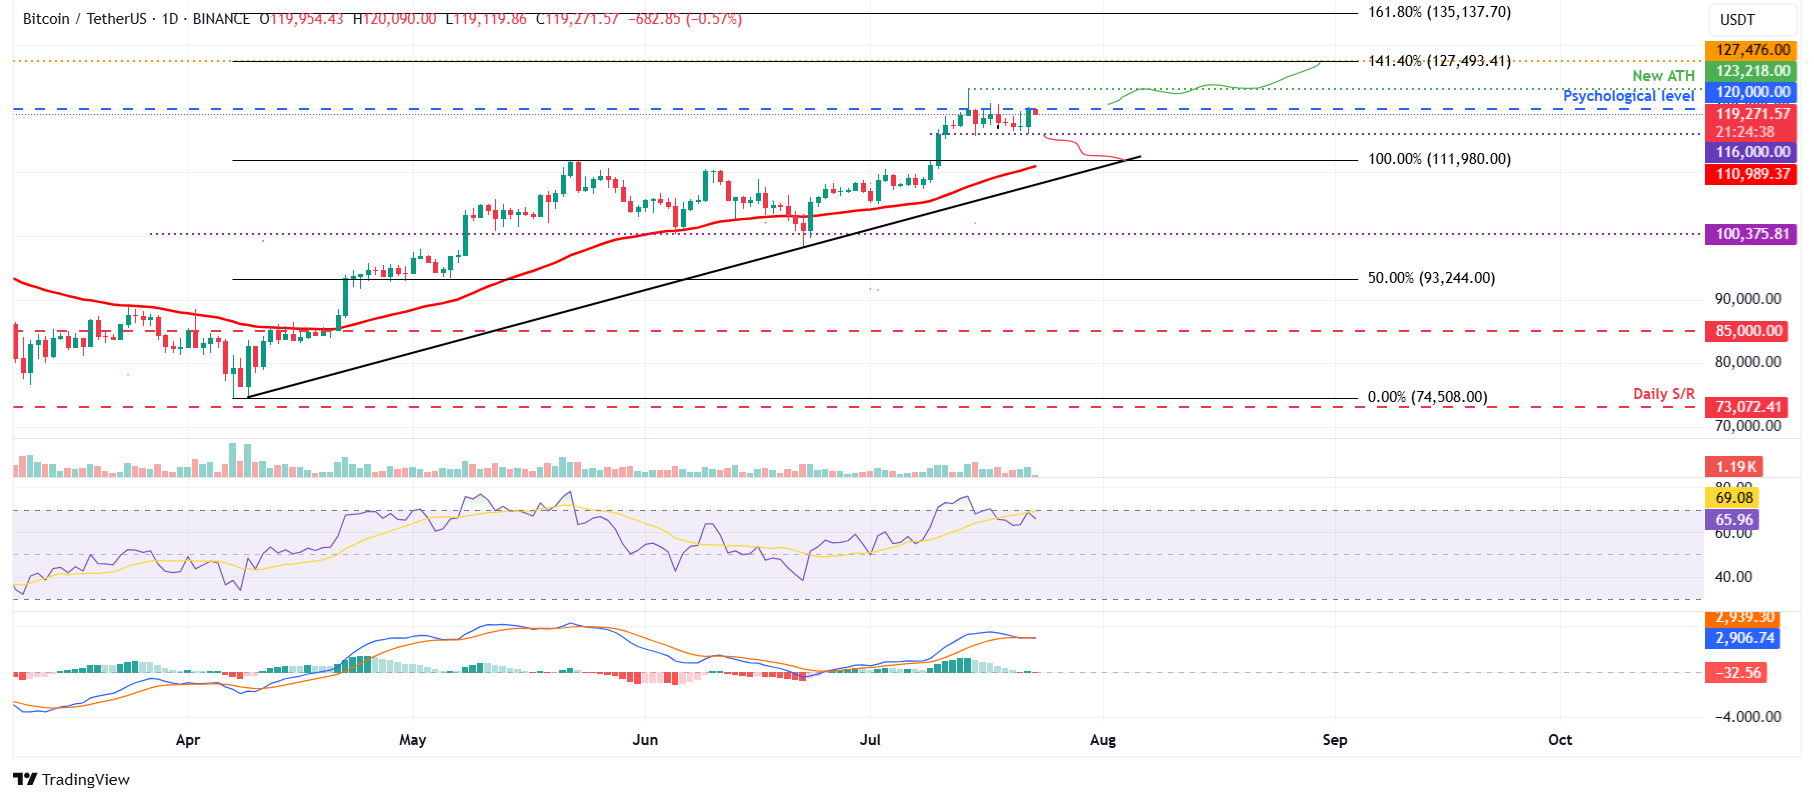
BTC/USDT daily chart
However, if BTC falls below the lower consolidation boundary at $116,000 on a daily basis, it could extend the decline to retest the 50-day Exponential Moving Average (EMA) at $110,989.
Ethereum finds support around its key level
Ethereum price rose 26.40% last week and closed above the daily resistance at $3,730 on Sunday. At the start of this week, ETH price stabilized above the daily level at $3,730. At the time of writing on Wednesday, it hovers around $3,736.
If the daily level at $3,730 continues to hold as support, ETH could extend the rally toward its next key psychological level at $4,000.
The RSI on the daily chart reads 85, which is above its overbought level of 70, indicating strong bullish momentum. The MACD indicator displayed a bullish crossover in early July that still holds. The rising green histogram bars above its neutral zero line suggest that bullish momentum is gaining traction.
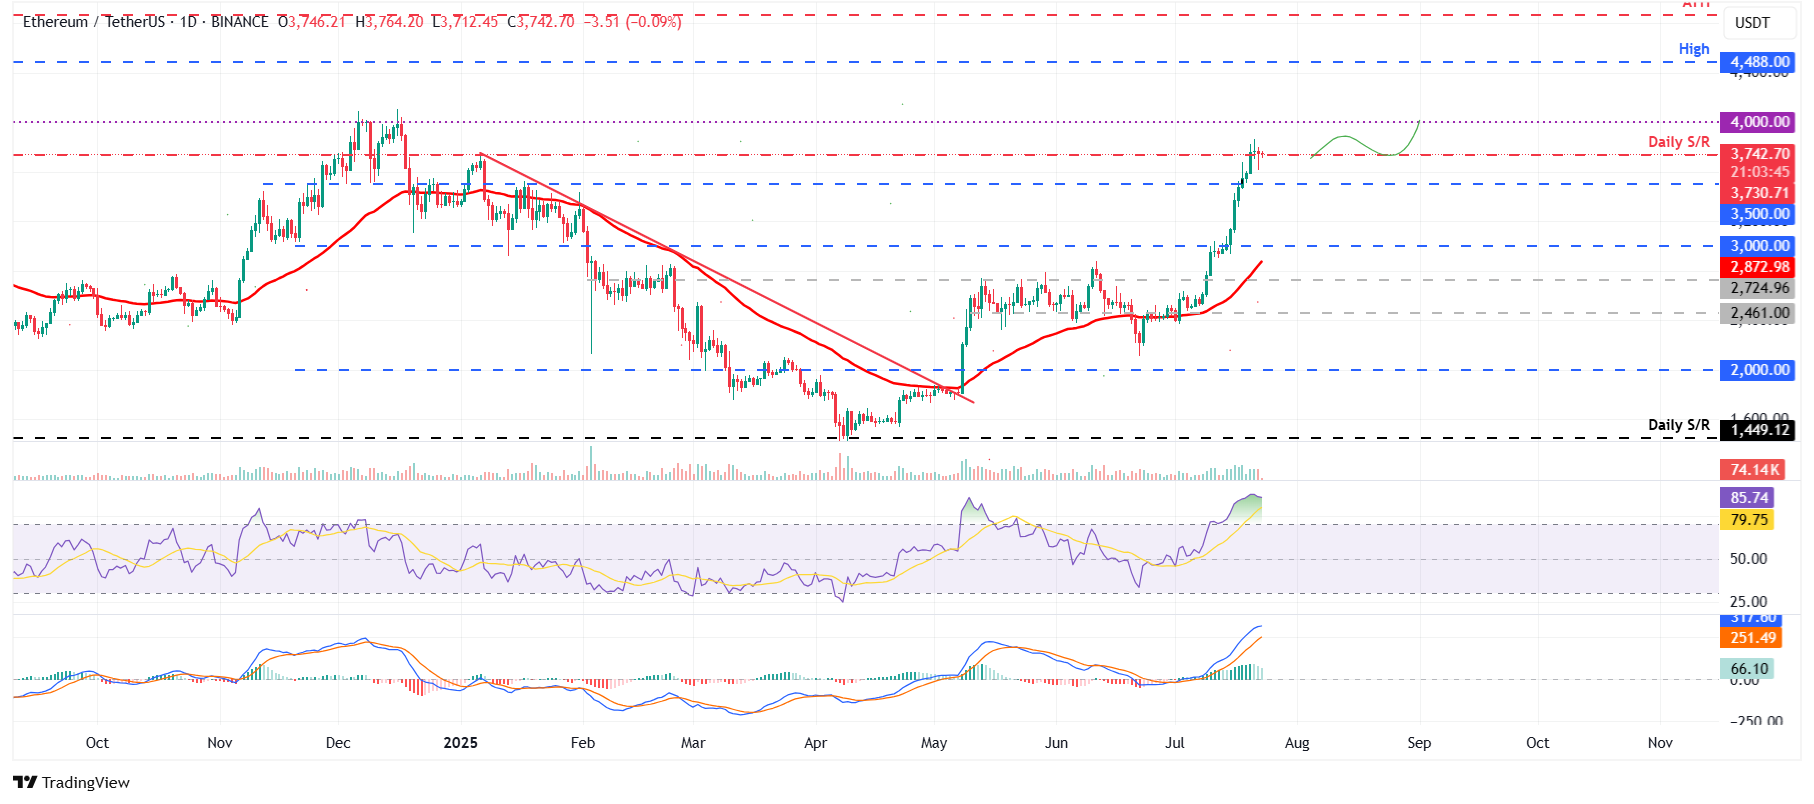
ETH/USDT daily chart
On the other hand, if ETH faces a correction and closes below the daily support level at $3,730, it could extend the decline to find support around its key level at $3,500.
XRP inching closer to all-time highs
XRP price rallied by more than 20% last week, reaching a new all-time high of $3.66 and declining slightly on Friday. XRP retested and found support around the key level at $3.40 on Saturday, and it recovered 4.15% over the next three days. At the time of writing on Wednesday, it hovers at around $3.50.
If XRP continues its upward trend, it could extend the rally toward the record level at $3.66. A successful close above this level will extend the rally toward its 141.40% Fibonacci extension level at $4.13, drawn from the January high of $3.40 to the April low of $1.61.
The RSI indicator on the daily chart reads 82, indicating an extreme overbought condition, which traders should be cautious of. However, like Ethereum, the MACD indicator also indicates further gains for XRP ahead.
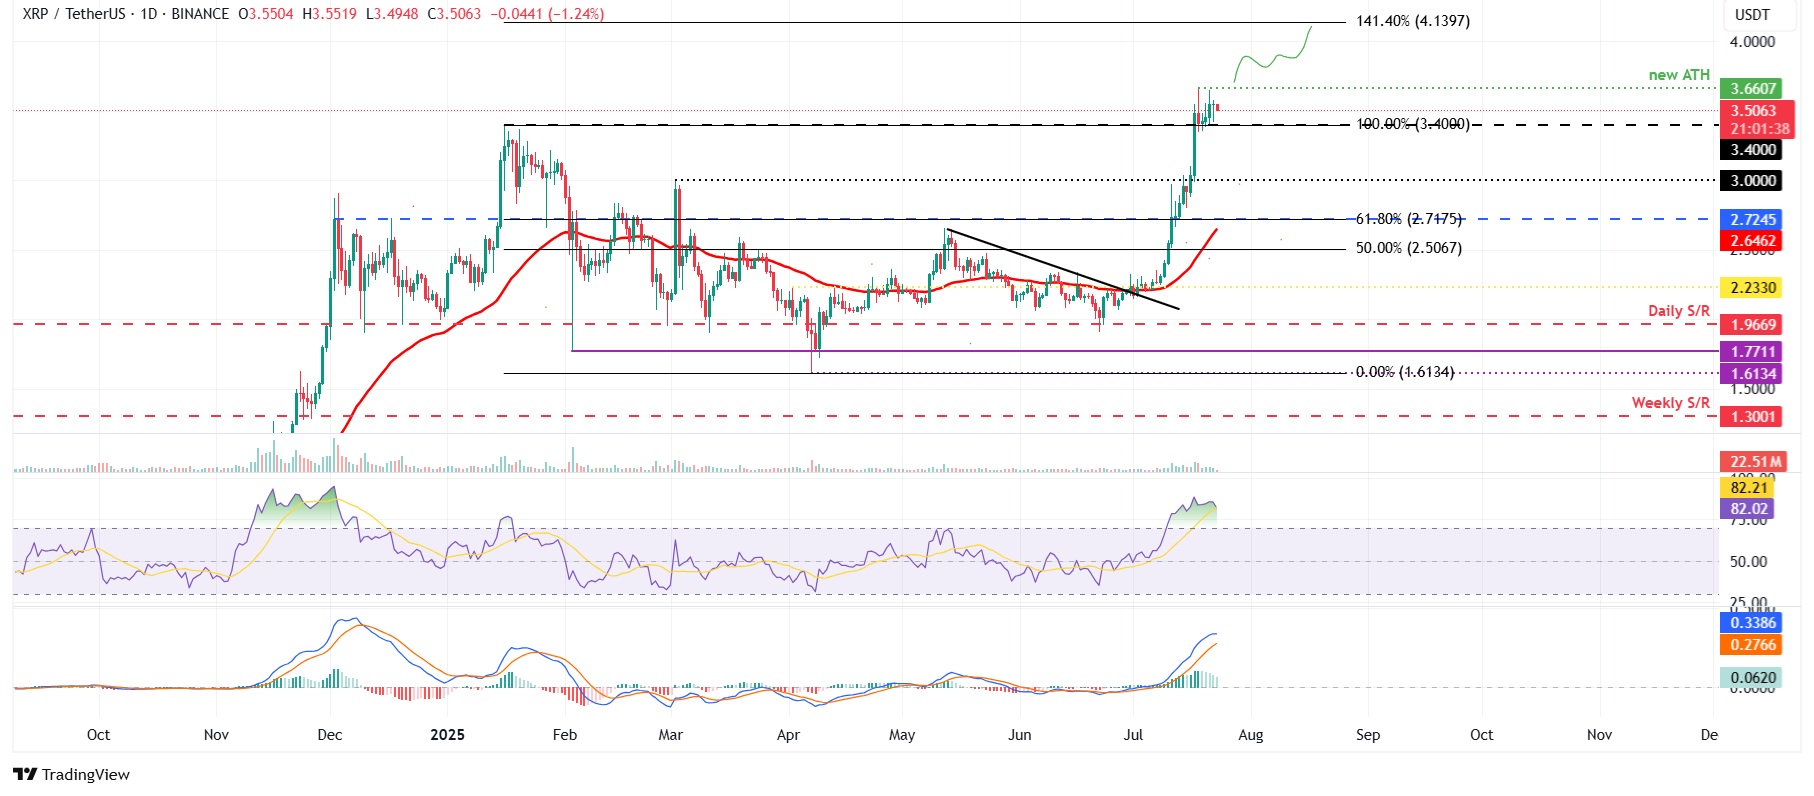
XRP/USDT daily chart
Conversely, if XRP faces a pullback, it could extend the decline to find support around its daily level at $3.40.