Kaspa ($KAS) price has just delivered an explosive breakout, gaining over 9% in a single day and pushing past the $0.10 psychological barrier. With bullish momentum building, traders are now eyeing the next key resistance at $0.12. But is this rally sustainable, or are we heading for a near-term correction?
This article takes a deep dive into the latest $KAS price daily chart using Heikin Ashi candlesticks, Fibonacci levels, and RSI indicators to evaluate the potential upside and downside in the days ahead.
Kaspa Price Prediction: Why Is $KAS Price Pumping Today?
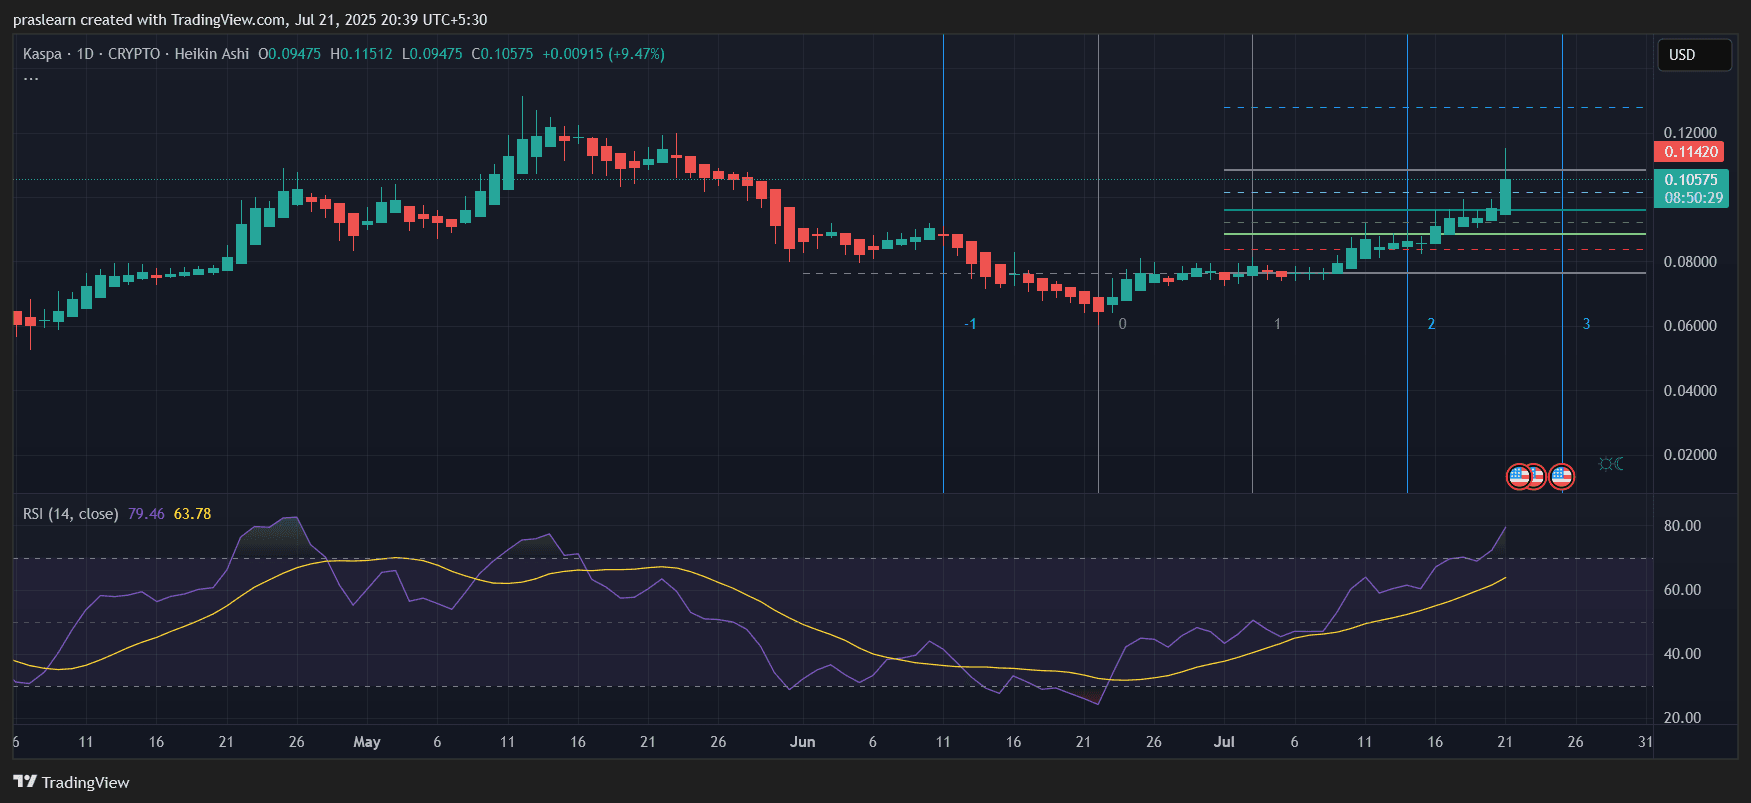
The $KAS/USD daily chart shows a clean bullish breakout from a multi-week accumulation phase. The Heikin Ashi candles flipped fully green, and today’s candle has a large body with no lower wick—indicating strong buying pressure and a decisive trend continuation.
$KAS price surged from $0.096 to $0.105, a 9.47% daily gain, clearly breaking out of its range-bound behavior. This breakout coincides with the Fibonacci golden pocket zone ($0.089–$0.093), which previously acted as a springboard.
RSI Analysis: Is Kaspa Overbought?
The Relative Strength Index (RSI) has surged to 79.46, entering overbought territory. While this indicates strong bullish momentum, it also signals caution—RSI levels above 70 often precede short-term pullbacks or consolidations.
However, it’s worth noting that strong trends can see RSI stretch to 85–90 before correcting. During the April rally, $KAS also saw extended RSI above 80, yet continued higher. So RSI alone shouldn’t be used to call a top here.
Fibonacci Levels Show Next Target at $0.114 and $0.12
Using the Fibonacci retracement tool from the previous swing high ($0.117) to the swing low ($0.065), we observe the following key levels:
- 0.618 Fib: $0.093 – Already broken
- 0.786 Fib: $0.105 – Tested today
- 1.0 Extension: $0.114 – Next resistance
- 1.272 Extension: $0.12 – Final barrier before blue-sky breakout
If Kaspa price maintains momentum and volume, $0.114 could be reached within the next few daily candles. A clean breakout above $0.12 would open the door for retesting the April high of $0.117 and possibly extend beyond that to new local highs.
Elliott Wave Impulse? A New Wave 3 Unfolding
Looking at the harmonic pattern and Fibonacci time zones plotted on the chart, it appears Kaspa price may have completed its Wave 2 correction and is entering a Wave 3 impulse leg—often the strongest in an Elliott Wave sequence.
Wave 1: $0.065 to $0.089 = $0.024 move
Wave 3 target (1.618 of Wave 1): $0.089 + (1.618 × 0.024) = $0.127
So, if $KAS price is indeed entering a full Wave 3, a move towards $0.125–$0.13 is technically viable.
Kaspa Price Prediction: How High Can $KAS Price Go This Week?
With strong breakout volume, a clean bullish structure, and favorable Fibonacci and Elliott projections, Kaspa price looks poised to test $0.114 and $0.12 in the near term. If bulls maintain control, an extension to $0.127 is possible.
However, traders should watch for any RSI divergence or signs of exhaustion near $0.12. A rejection here could trigger a pullback toward the $0.093–$0.096 support range, which now becomes a key demand zone.
Summary Price Targets:
- Immediate Resistance: $0.114
- Short-Term Target: $0.12
- Bullish Extension: $0.127
- Key Support: $0.093–$0.096