
With Bitcoin holding above $120,000 and Ethereum steady near $3,000, the bullish momentum has spilled over to Chinese coins.
The “Made in China” crypto index is up nearly 1% in the past 24 hours, with top performers like VeChain, Conflux, and Qtum flashing strong weekly gains and key indicator shifts. Here’s a look at their trend setups going into the third week of July.
VeChain ($VET)
VeChain, a blockchain platform known for its supply chain traceability and enterprise use cases, is showing signs of a trend reversal after a strong weekly gain.
Currently trading just above $0.025, $VET, VeChain’s native made in China coin, is still down nearly 91% from its all-time high of $0.282, but buyers seem to be stepping in.
Over the past week, $VET has surged 21.5%, and now faces immediate resistance at $0.02629. A successful breakout above this level could open the path to $0.02769, a level where previous rally attempts have struggled.
However, the more interesting setup lies in the divergence forming on the chart.
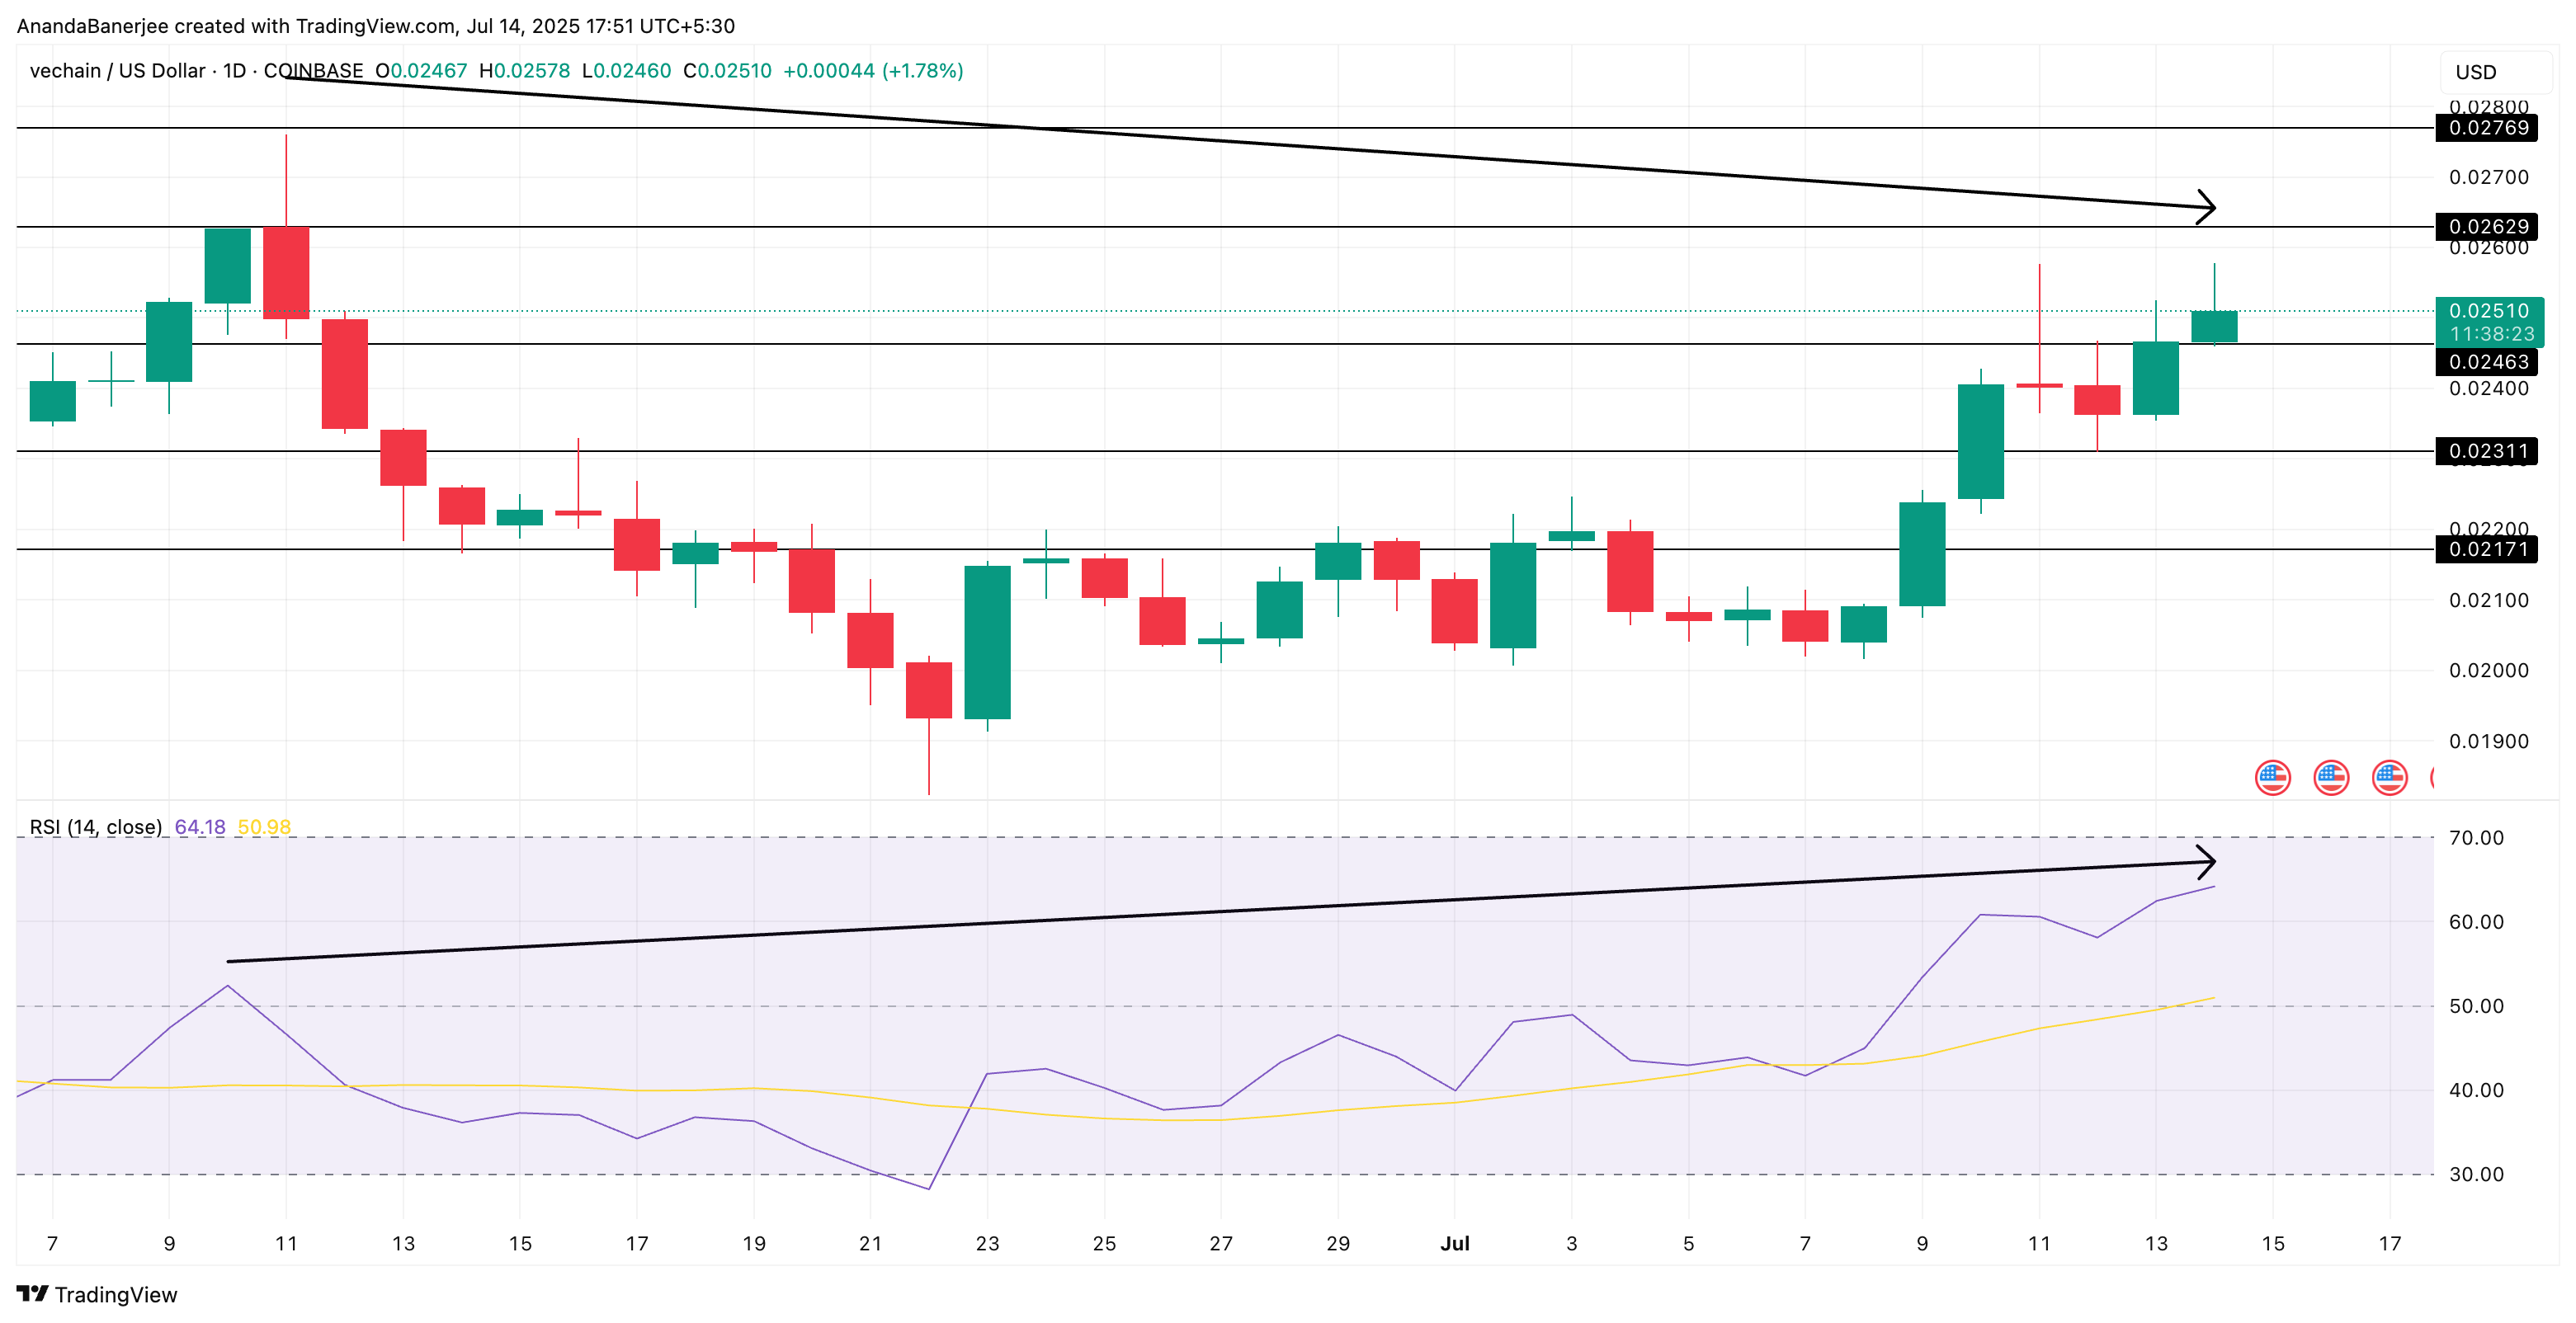
The RSI (Relative Strength Index) is making higher highs, while the price is still making lower highs: a pattern known as bullish divergence. This indicates that although the price hasn’t caught up yet, momentum is gradually shifting in favor of the bulls.
On the downside, $0.02311 is the first critical support. But the real invalidation of this bullish structure begins below $0.02171, the breakout candle that initiated the current uptrend. If $VET slips below that, the bullish hypothesis would likely be nullified, and sellers could regain control.
As long as $VET holds above $0.023 and keeps building higher RSI strength, the trend remains constructive.
Conflux ($CFX)
Conflux is one of China’s most prominent public blockchains, designed to support high-speed decentralized apps and regulatory compliance.
The made-in-China $CFX coin is up 40.2% in the past week, now trading slightly above $0.103, showing strong short-term momentum. However, it remains 94% below its all-time high of $1.70, leaving plenty of room for recovery or risk.
On the chart, $0.1042 is the nearest resistance. A clean breakout above this could push $CFX toward $0.1233, with little technical resistance in between. That price gap may act as a driver if market momentum holds.
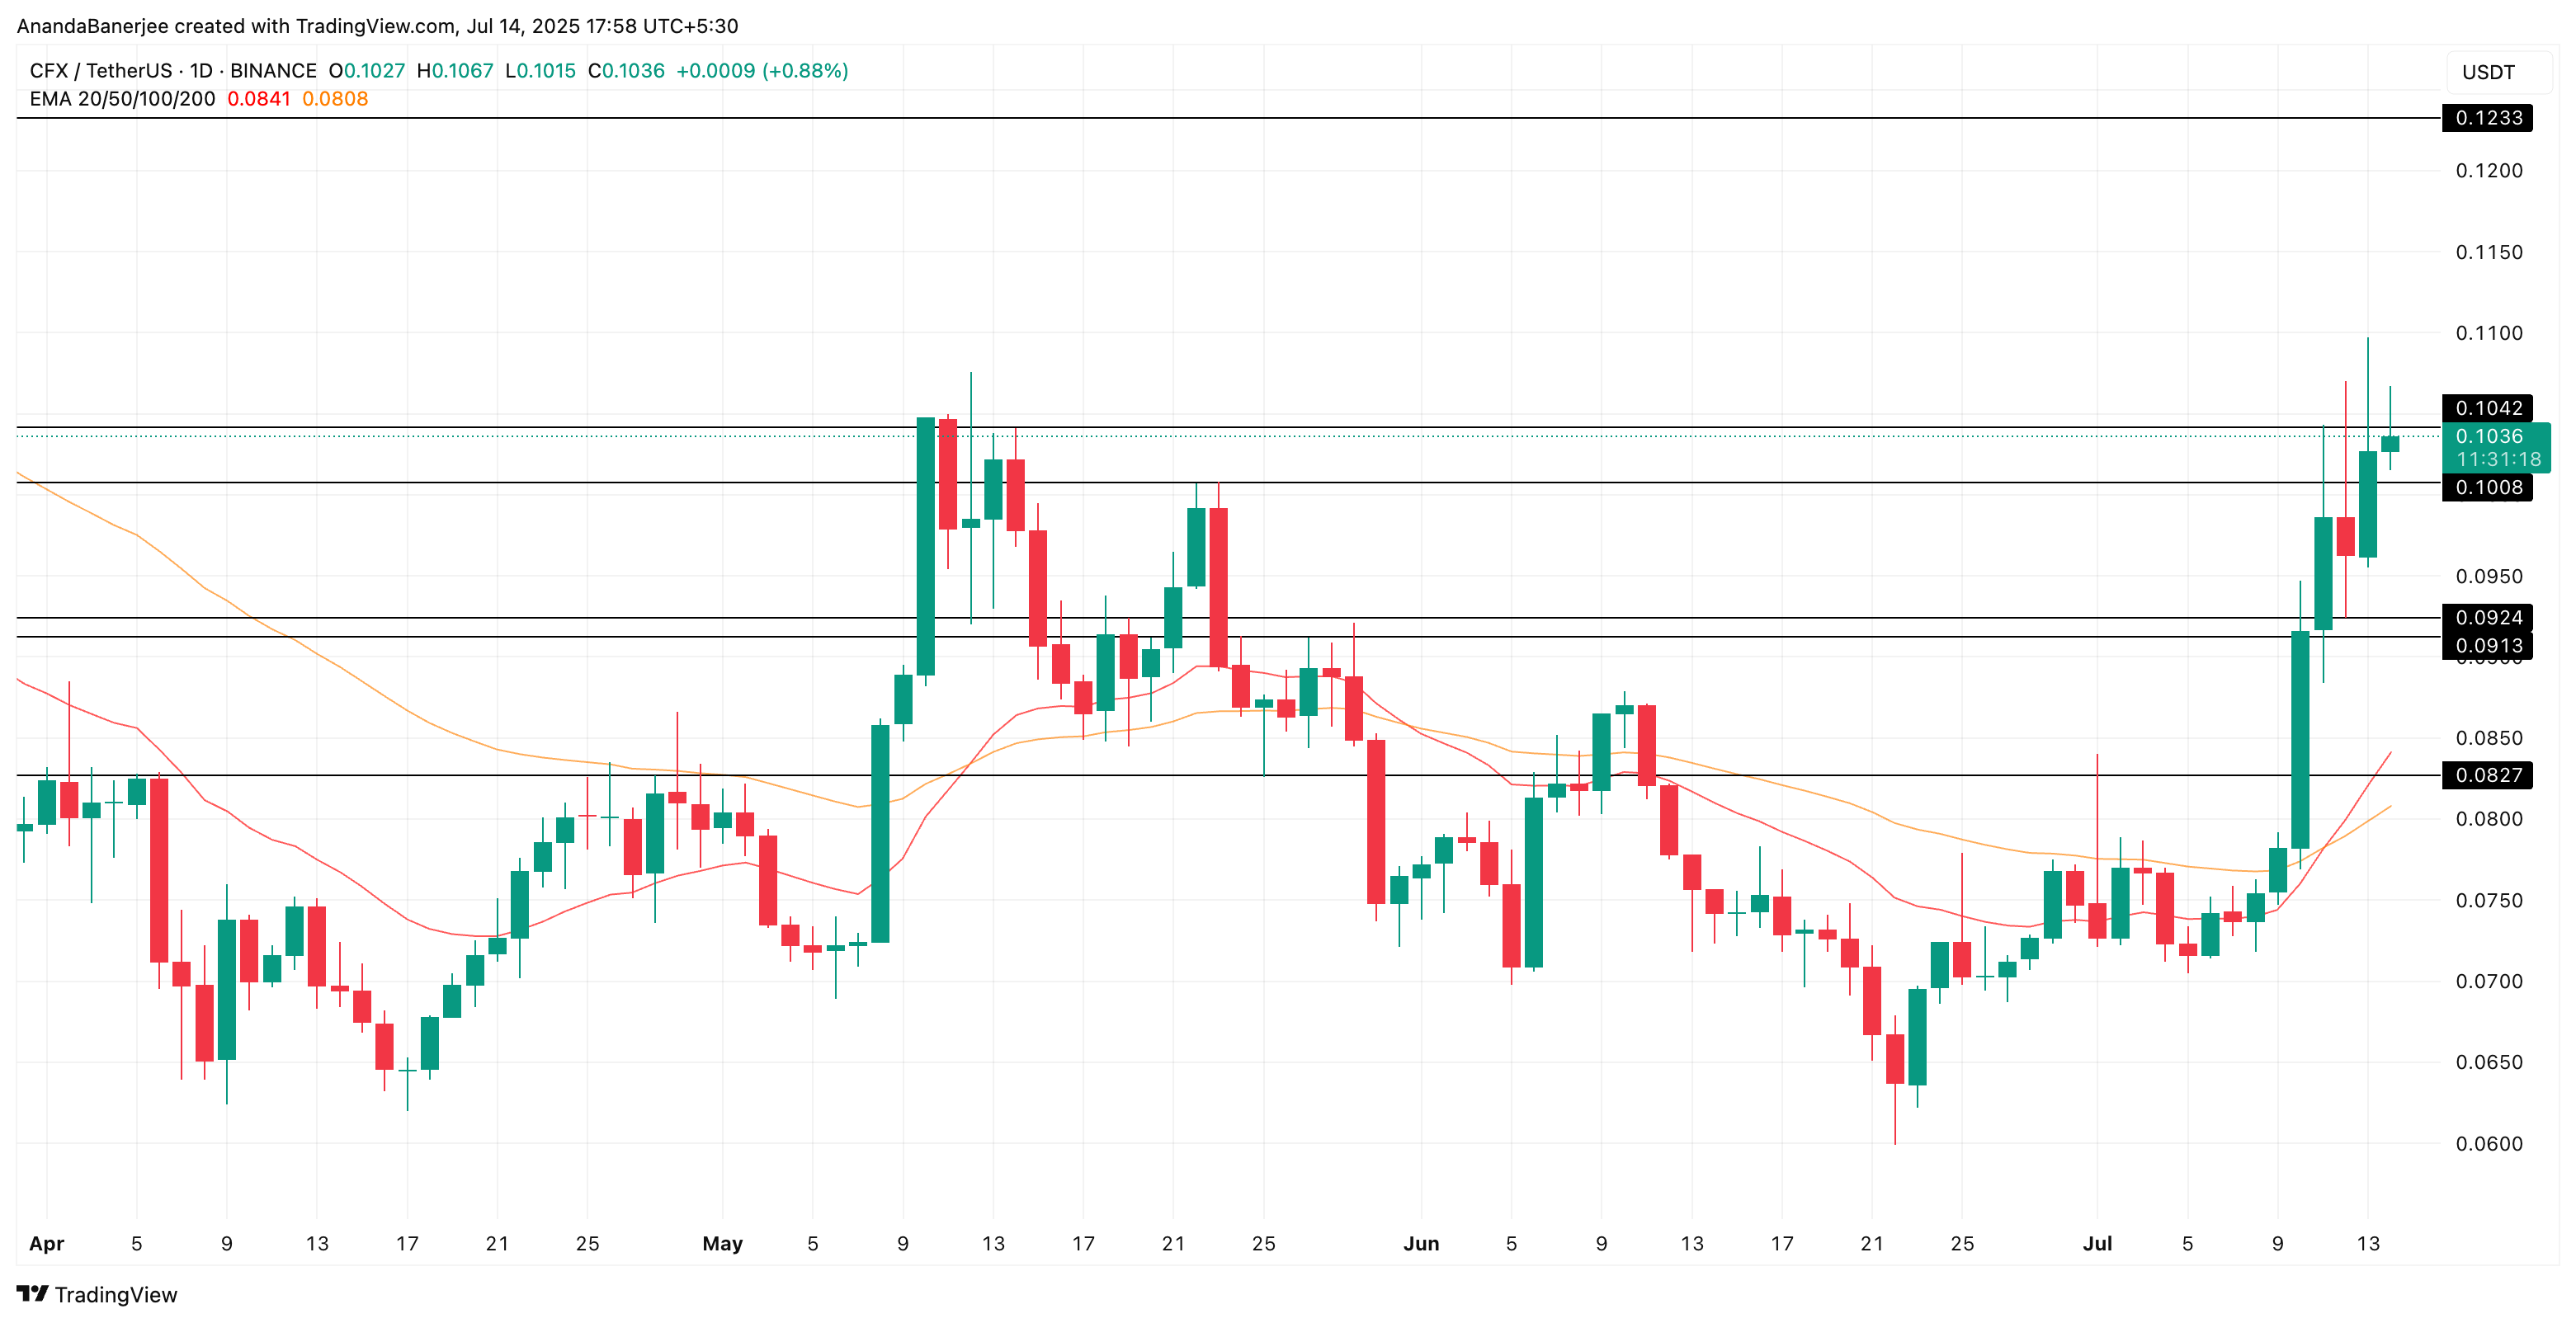
On the downside, multiple supports exist around $0.1008, $0.0913, and $0.0827. But the real bullish invalidation lies under $0.0827. That’s the level where structure breaks down, potentially shifting trend direction even in a strong altcoin cycle.
One bullish technical signal stands out: the 20-day EMA (Exponential Moving Average) recently crossed above the 50-day EMA and is widening.
This isn’t the usual 50–200 day golden cross, but it still signals a short-term trend acceleration, especially when the angle of divergence increases like this. The tighter timeframe makes this a more reactive indicator, highlighting how fast short-term sentiment has turned bullish.
As long as $CFX holds above $0.1008 and this EMA gap continues to widen, bulls may stay in charge.
Qtum ($QTUM)
Qtum is one of the earliest hybrid blockchains developed out of China, mixing the account-based Ethereum system with Bitcoin’s UTXO model. The ‘made in China’ blockchain’s coin, $QTUM, once hit an all-time high of $106.88, but today it trades around $2.31, still down nearly 98% from that historic peak. That said, Qtum has gained 16.8% over the past week, hinting at fresh momentum.
From a trend-based Fibonacci extension drawn from the June 22 low of $1.73 to the July 9 high of $2.382, and then a correction to $2.187, multiple upside targets emerge.
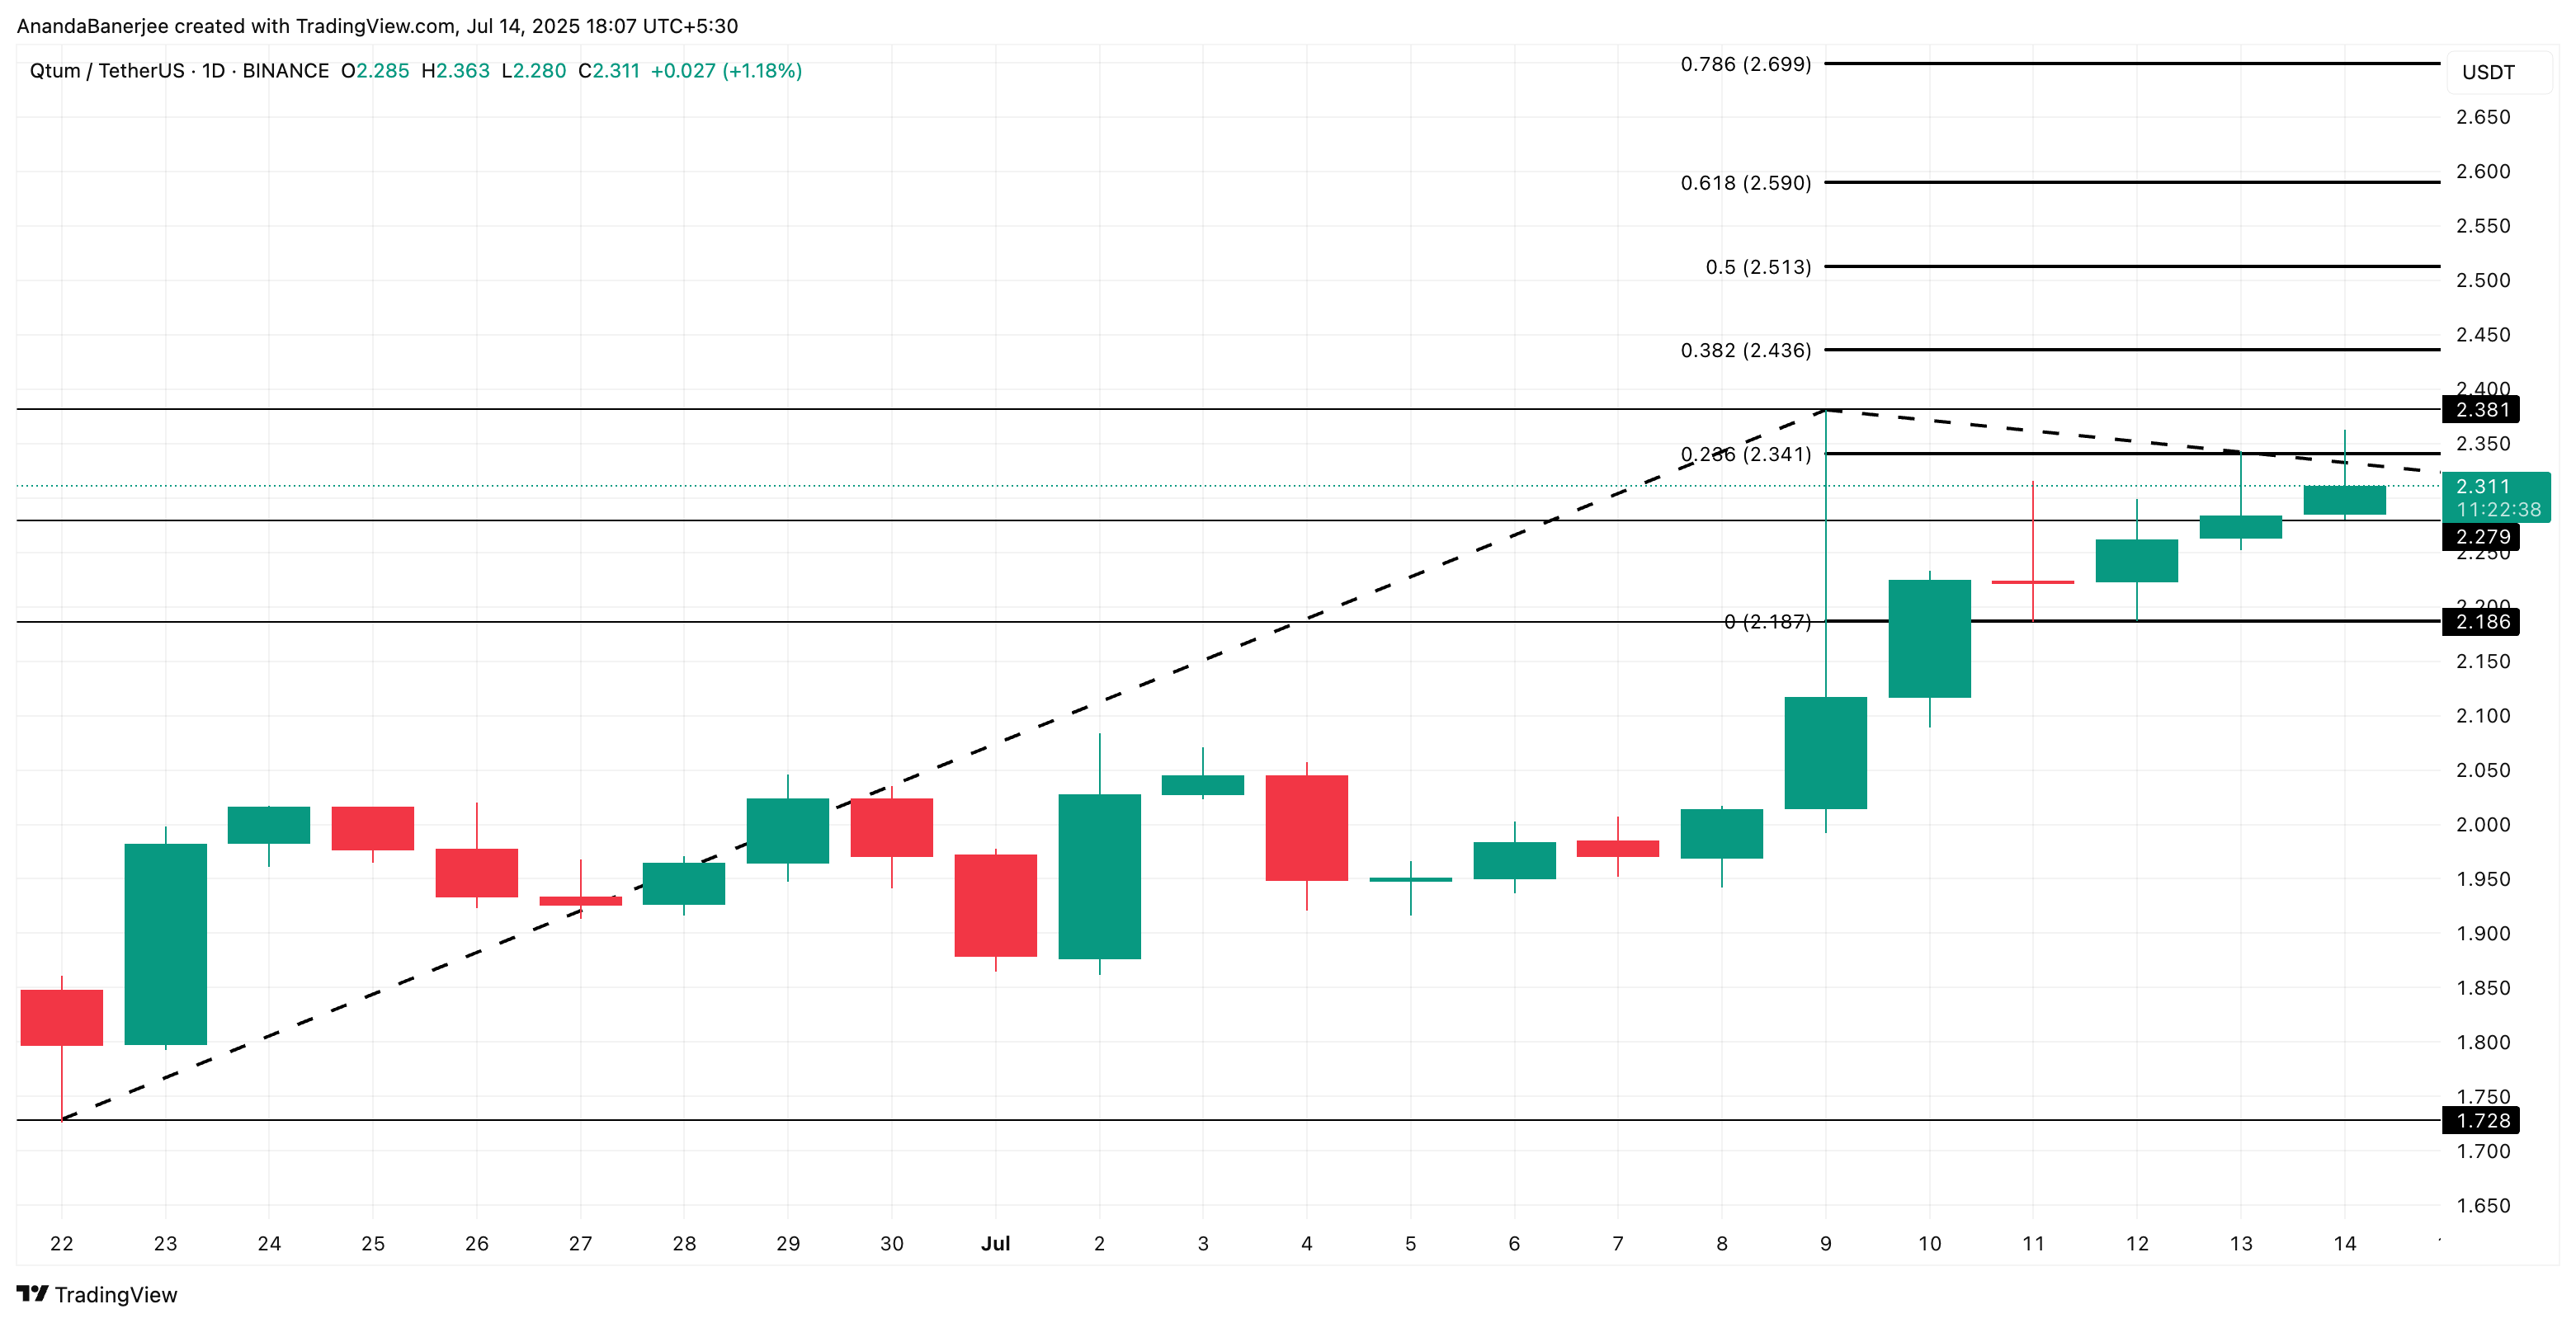
$QTUM breached the immediate resistance at $2.341 earlier, but quickly faced rejection and is now consolidating just above $2.279, a key horizontal support level.
The trend stays intact as long as $QTUM holds above $2.187, the minor retracement point. If the bulls manage to push through the $2.341 resistance again with volume, the next targets become $2.436, followed by $2.513, per the Fibonacci extension.
If the price drops under $2.187, the breakout structure invalidates. And a breakdown below $1.728; the original impulse start would likely nullify the broader bullish thesis.
In short, $QTUM is trying to reclaim trend strength after years of underperformance. The technical setup offers hope, but the $2.341 barrier remains the key to unlock higher targets.