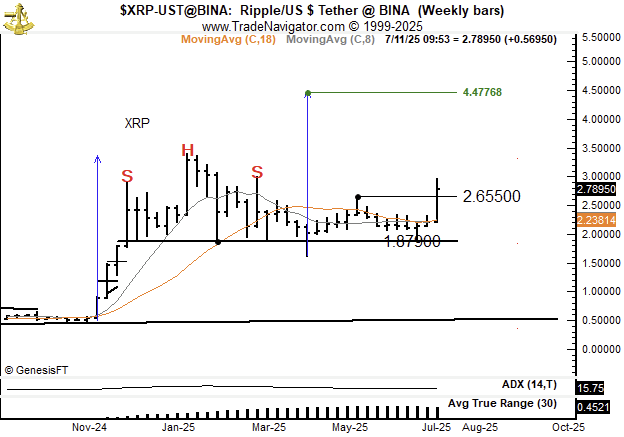
"Unless $XRP closes back below this week's low my interpretation will remain that this pattern is best described as a compound fulcrum until proven differently," Brandt stated.
The price target of this pattern is $4.40, which represents a 58% increase and a major breakout from current trading levels.
In a tweet yesterday, Brandt highlighted $XRP's upward trend: "Everything I've come to know know about charts informs me that the next trend in this mystery market will be Up Up Up."
From bearish to bullish: Chart morphs
Brandt’s analysis marks a sharp turn from his previous bearish outlook. In a tweet, Brandt explains his rationale, which is that charts are always morphing and that chart patterns might sometimes fail.
According to Brandt, "Charts are always morphing—they might morph from a possible chart formation with one implied outcome into another chart pattern with different implications."
Chart patterns sometimes fail, according to Brandt, referring to $XRP’s false breakout in April, which initially hinted at a bearish Head & Shoulders top. However, that formation was swiftly invalidated.
"There is actually more meaning in a failed pattern than in a completed pattern. You do not understand that $XRP actually had a completed intraday H&S top in early April. This action was quickly negated," Brandt said.

 u.today