Meme token Shiba inu
$SHIB surged 5.2% in the past 24 hours, climbing from $0.00001136 to $0.00001195 with significant volume spikes, establishing a new support level at a high-volume support level at $0.00001162.
The upswing marked the completion of the inverse head-and-shoulders (H&S) pattern on the hourly chart, confirming a bullish shift in momentum. An inverse H&S, appearing after a notable sell-off, as in $SHIB's case, comprises three troughs, with the middle one being the lowest and flanked by shallow and equidistant ones on either side.
"Technical indicators suggest continued bullish momentum as $SHIB maintains prices above the newly established support levels," CoinDesk's AI research said.
Key AI insights
- $SHIB demonstrated remarkable strength during the 24 hours from July 2, 12:00 to July 3, 11:00, climbing from $0.00001136 to $0.00001200, representing a 5.65% gain with a price range of $0.00000081.
- The token experienced a significant volume spike at 16:00 on July 2 (1.68B), establishing a high-volume support level at $0.00001162.
- The 24-hour volume profile confirms strong buyer interest, particularly during the European trading session.
- During the 60 minutes from 3 July 10:09 to 11:08, $SHIB experienced notable volatility, initially trading at $0.00001204 before declining to $0.00001199, representing a 0.41% decrease.
- A significant volume spike occurred at 10:18 (15.01B), followed by an even larger spike at 11:04 (20.94B), coinciding with a price recovery from the session low of $0.00001195 at 10:50.
- The 5-hour period between 05:00 and 10:00 on July 3 saw sustained trading above $0.0000120, forming a new resistance zone.
$BONK surges
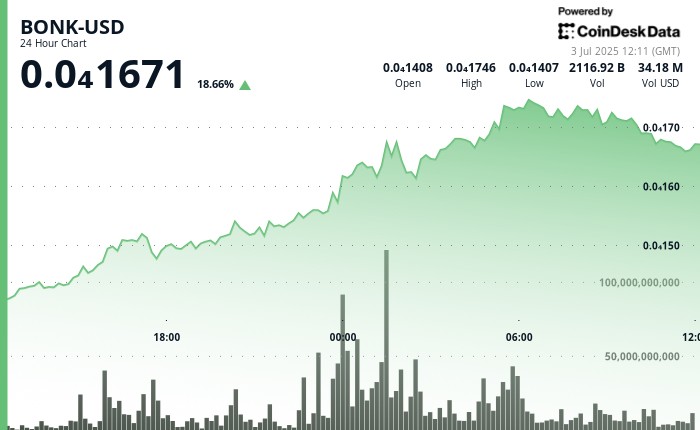
$BONK, a memecoin built on the Solana blockchain in late 2022, has surged 23% to $0.00001665 in the past 24 hours, becoming the best-performing top 100 cryptocurrency by market value.
According to CoinDesk's AI, the rally featured three distinct waves, with the most aggressive buying occurring between 23:00 and 01:00, when volume peaked at nearly 3 trillion units, establishing a high-volume support zone around $0.0000161.
The cryptocurrency also approached a one-million holder milestone. These bullish developments follow reports that Tuttle Capital’s proposed 2x Long $BONK ETF has taken a procedural step forward.
Speaking of technical analysis, $BONK's hourly price chart displays a $SHIB-like inverse head-and-shoulders bullish reversal pattern.
Key AI insights
- $BONK-USD demonstrated remarkable strength over the 24 hours from 2 July 12:00 to 3 July 11:00, surging from $0.0000142 to $0.0000167, representing a 17% gain.
- A significant price range of $0.00000345 (24%) was observed, with strong volume-supported resistance at the $0.0000174 level during the 5:00 hour on July 3rd.
- During the 60 minutes from July 3, 10:34 to 11:33, $BONK-USD experienced significant volatility, declining 1.35% from $0.00001689 to $0.00001667.
- A notable sell-off occurred at 10:42 when the price dropped 7.6% amid peak volume of 95.9 billion units.