
- Sei extends the weekly run on Wednesday, hitting a new two-month high.
- Maple Finance records a new all-time high, nearing a channel breakout.
- Aptos ticks lower after two days of recovery, bouncing off the lower boundary of a falling channel.
The broader cryptocurrency market is trading in the green, with Sei ($SEI), Maple Finance ($SYRUP), and Aptos ($APT) leading the gains over the last 24 hours as of press time. The market experiences a sudden surge in demand for Made in America tokens, such as Sei and Aptos, while the fragile Iran-Israel ceasefire remains in place. Still, the broader market's risk appetite remains subdued as tensions in the Middle East persist.
$SEI outpaces the broader market, targets $0.3642
$SEI trades in the green by over 5% at press time on Wednesday, hitting a two-month high with its third consecutive daily green candle. The Made in America token outpaces the broader market recovery, with an almost 65% jump so far this week.
With a daily close above $0.2923, the March high, $SEI eyes further gains to the $0.3642 level, marked by the January 14 close.
The Moving Average Convergence/Divergence (MACD) indicator shows the MACD and signal line trending higher above the zero line. Coupled with the expanding green histogram bars, the indicator flashes a buy signal.
The Relative Strength Index (RSI) indicates a significant surge in buying pressure as it reaches overbought conditions at 78. However, investors must remain cautious as reversals are more likely to occur in overbought conditions.
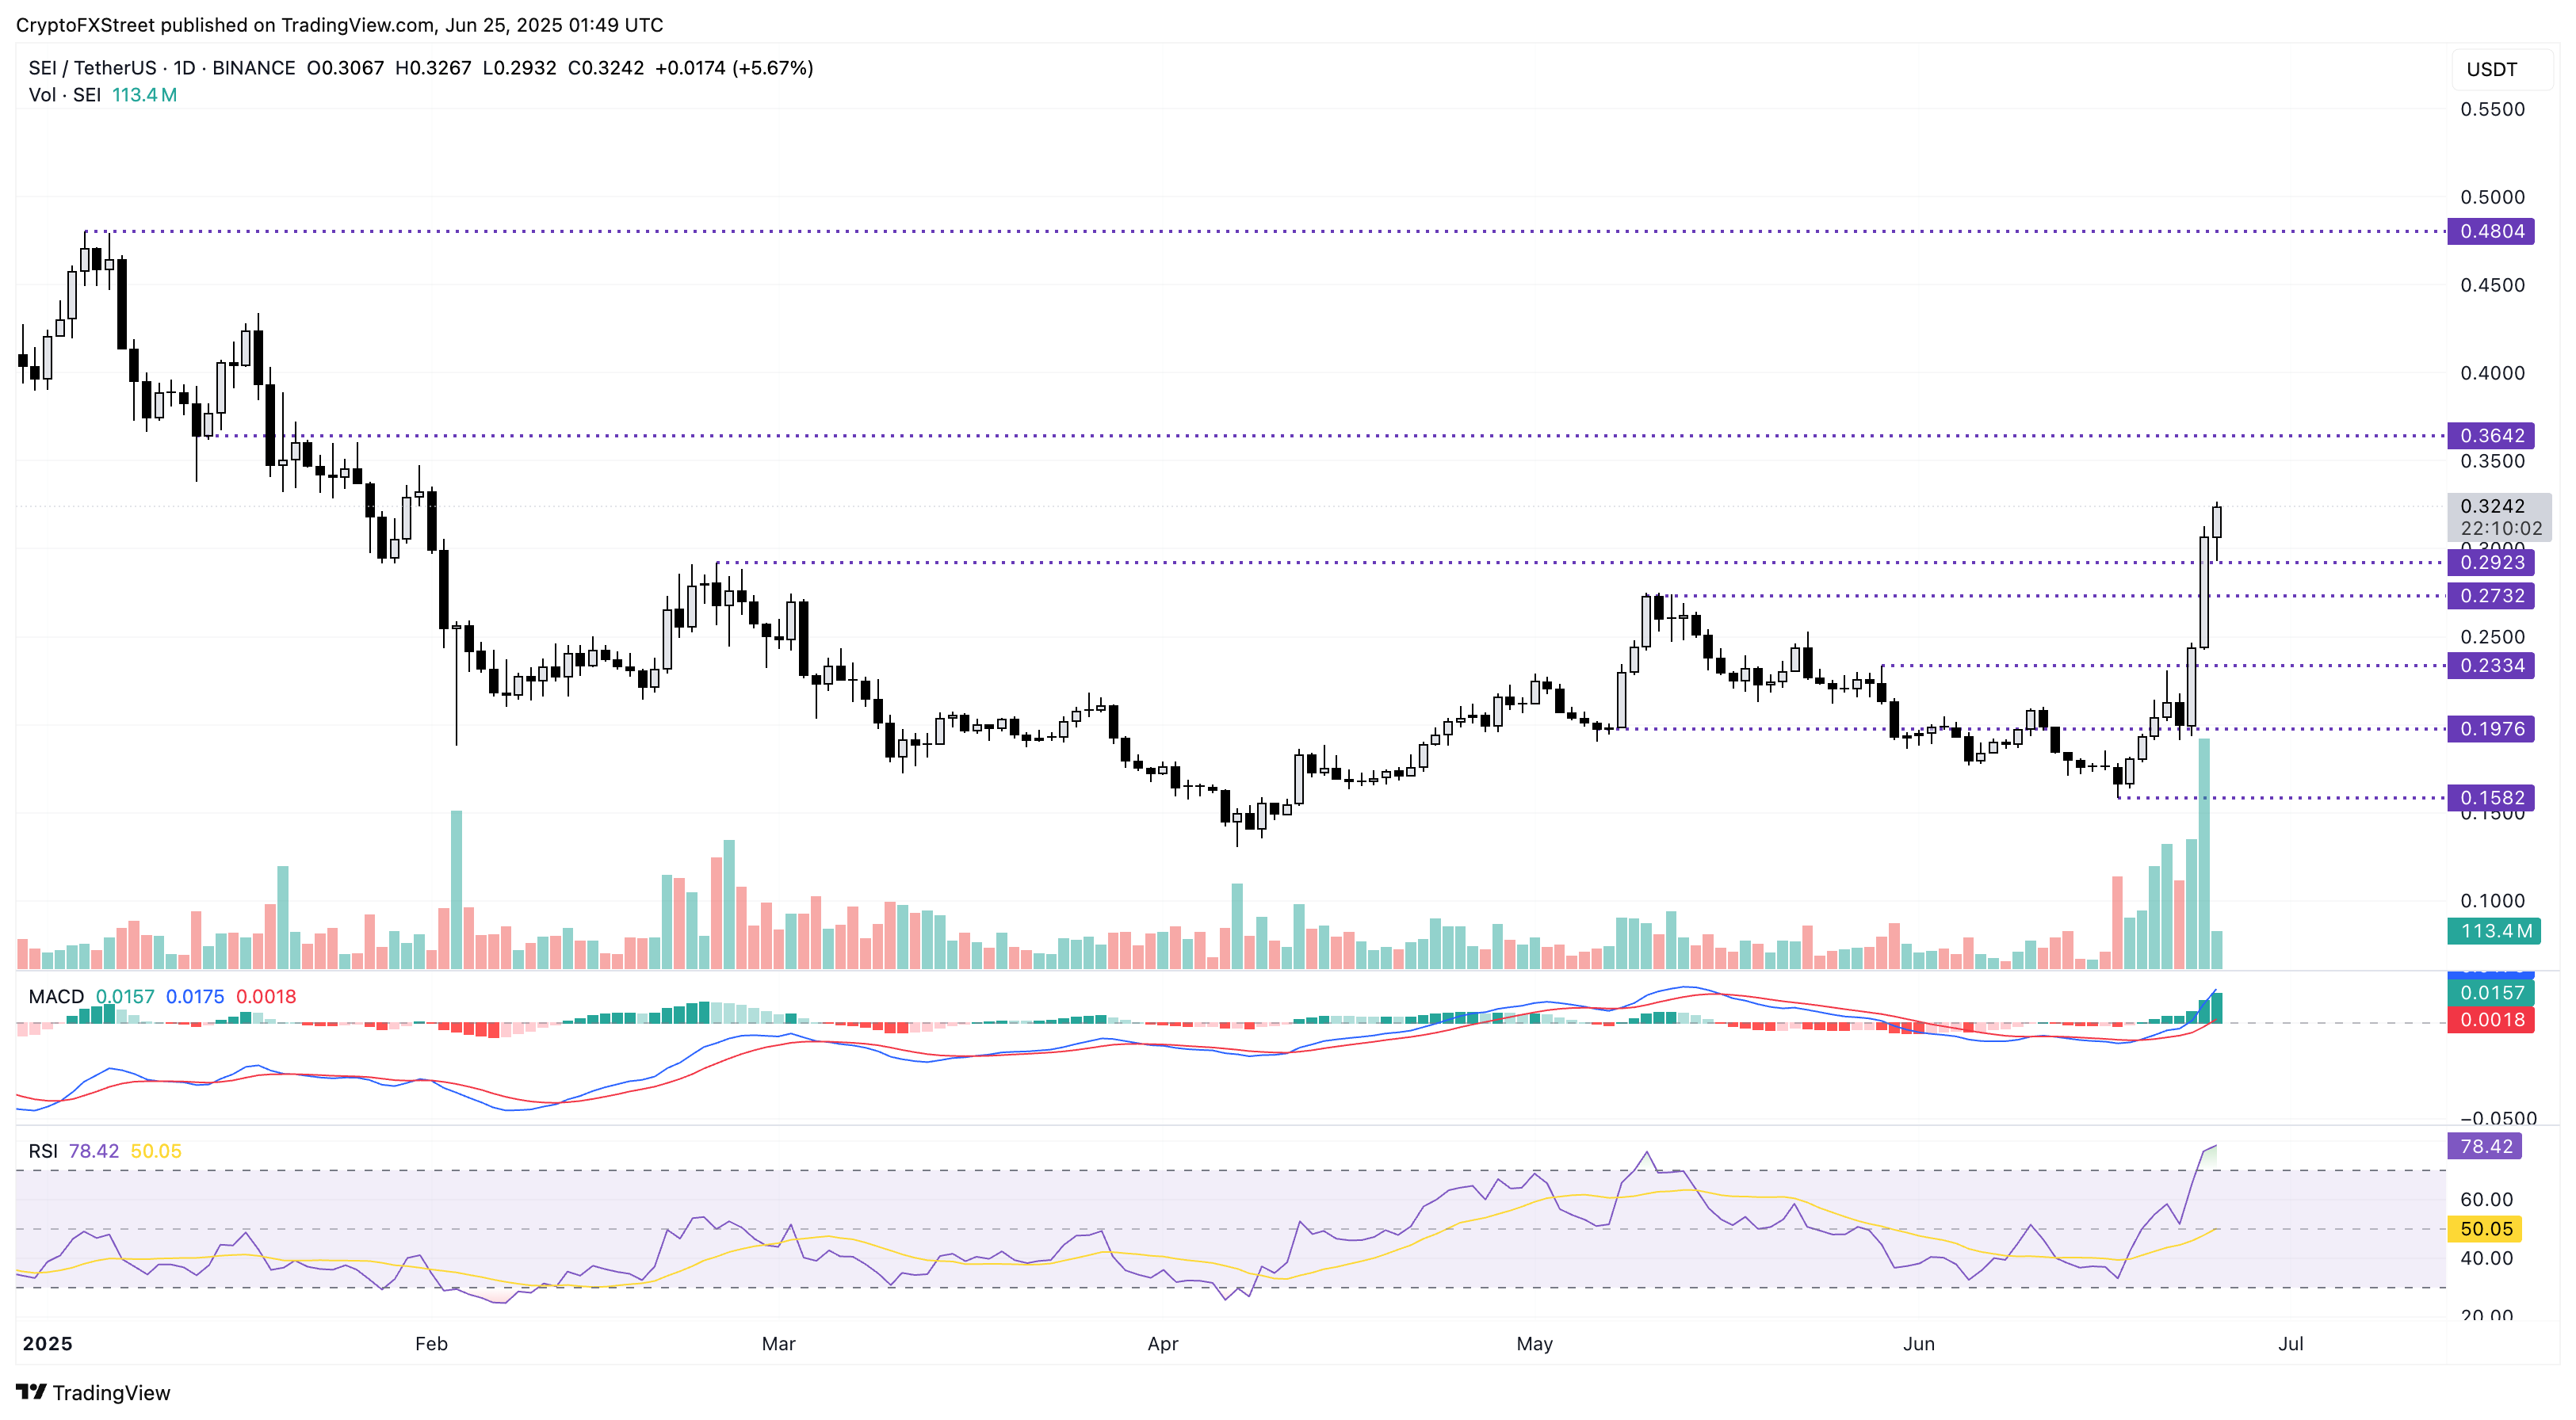
$SEI/$USDT daily price chart.
If a reversal in Sei closes below $0.2923, it could further decline towards $0.2732 support level marked by the highest price in May.
$SYRUP hits all-time high, eyes $0.80
$SYRUP records a new all-time high of $0.60, with an over 6% surge at press time on Wednesday. With three consecutive bullish candles, the $SYRUP token has surpassed the overhead trendline formed by the swing highs on May 25, June 11, and June 16.
A potential closing above the trendline will mark a rising channel breakout formed by a parallel support connected by May 7, May 31, and June 22. As per the Pivot Points Standard indicator, the breakout rally could target the R2 level at $0.63, followed by R3 at $0.80.
The MACD indicator flashes a buy signal as the MACD line crosses above the signal line, triggering the rise of green histogram bars from the zero line.
The RSI approaches the overbought boundary, indicating a surge in buying pressure.
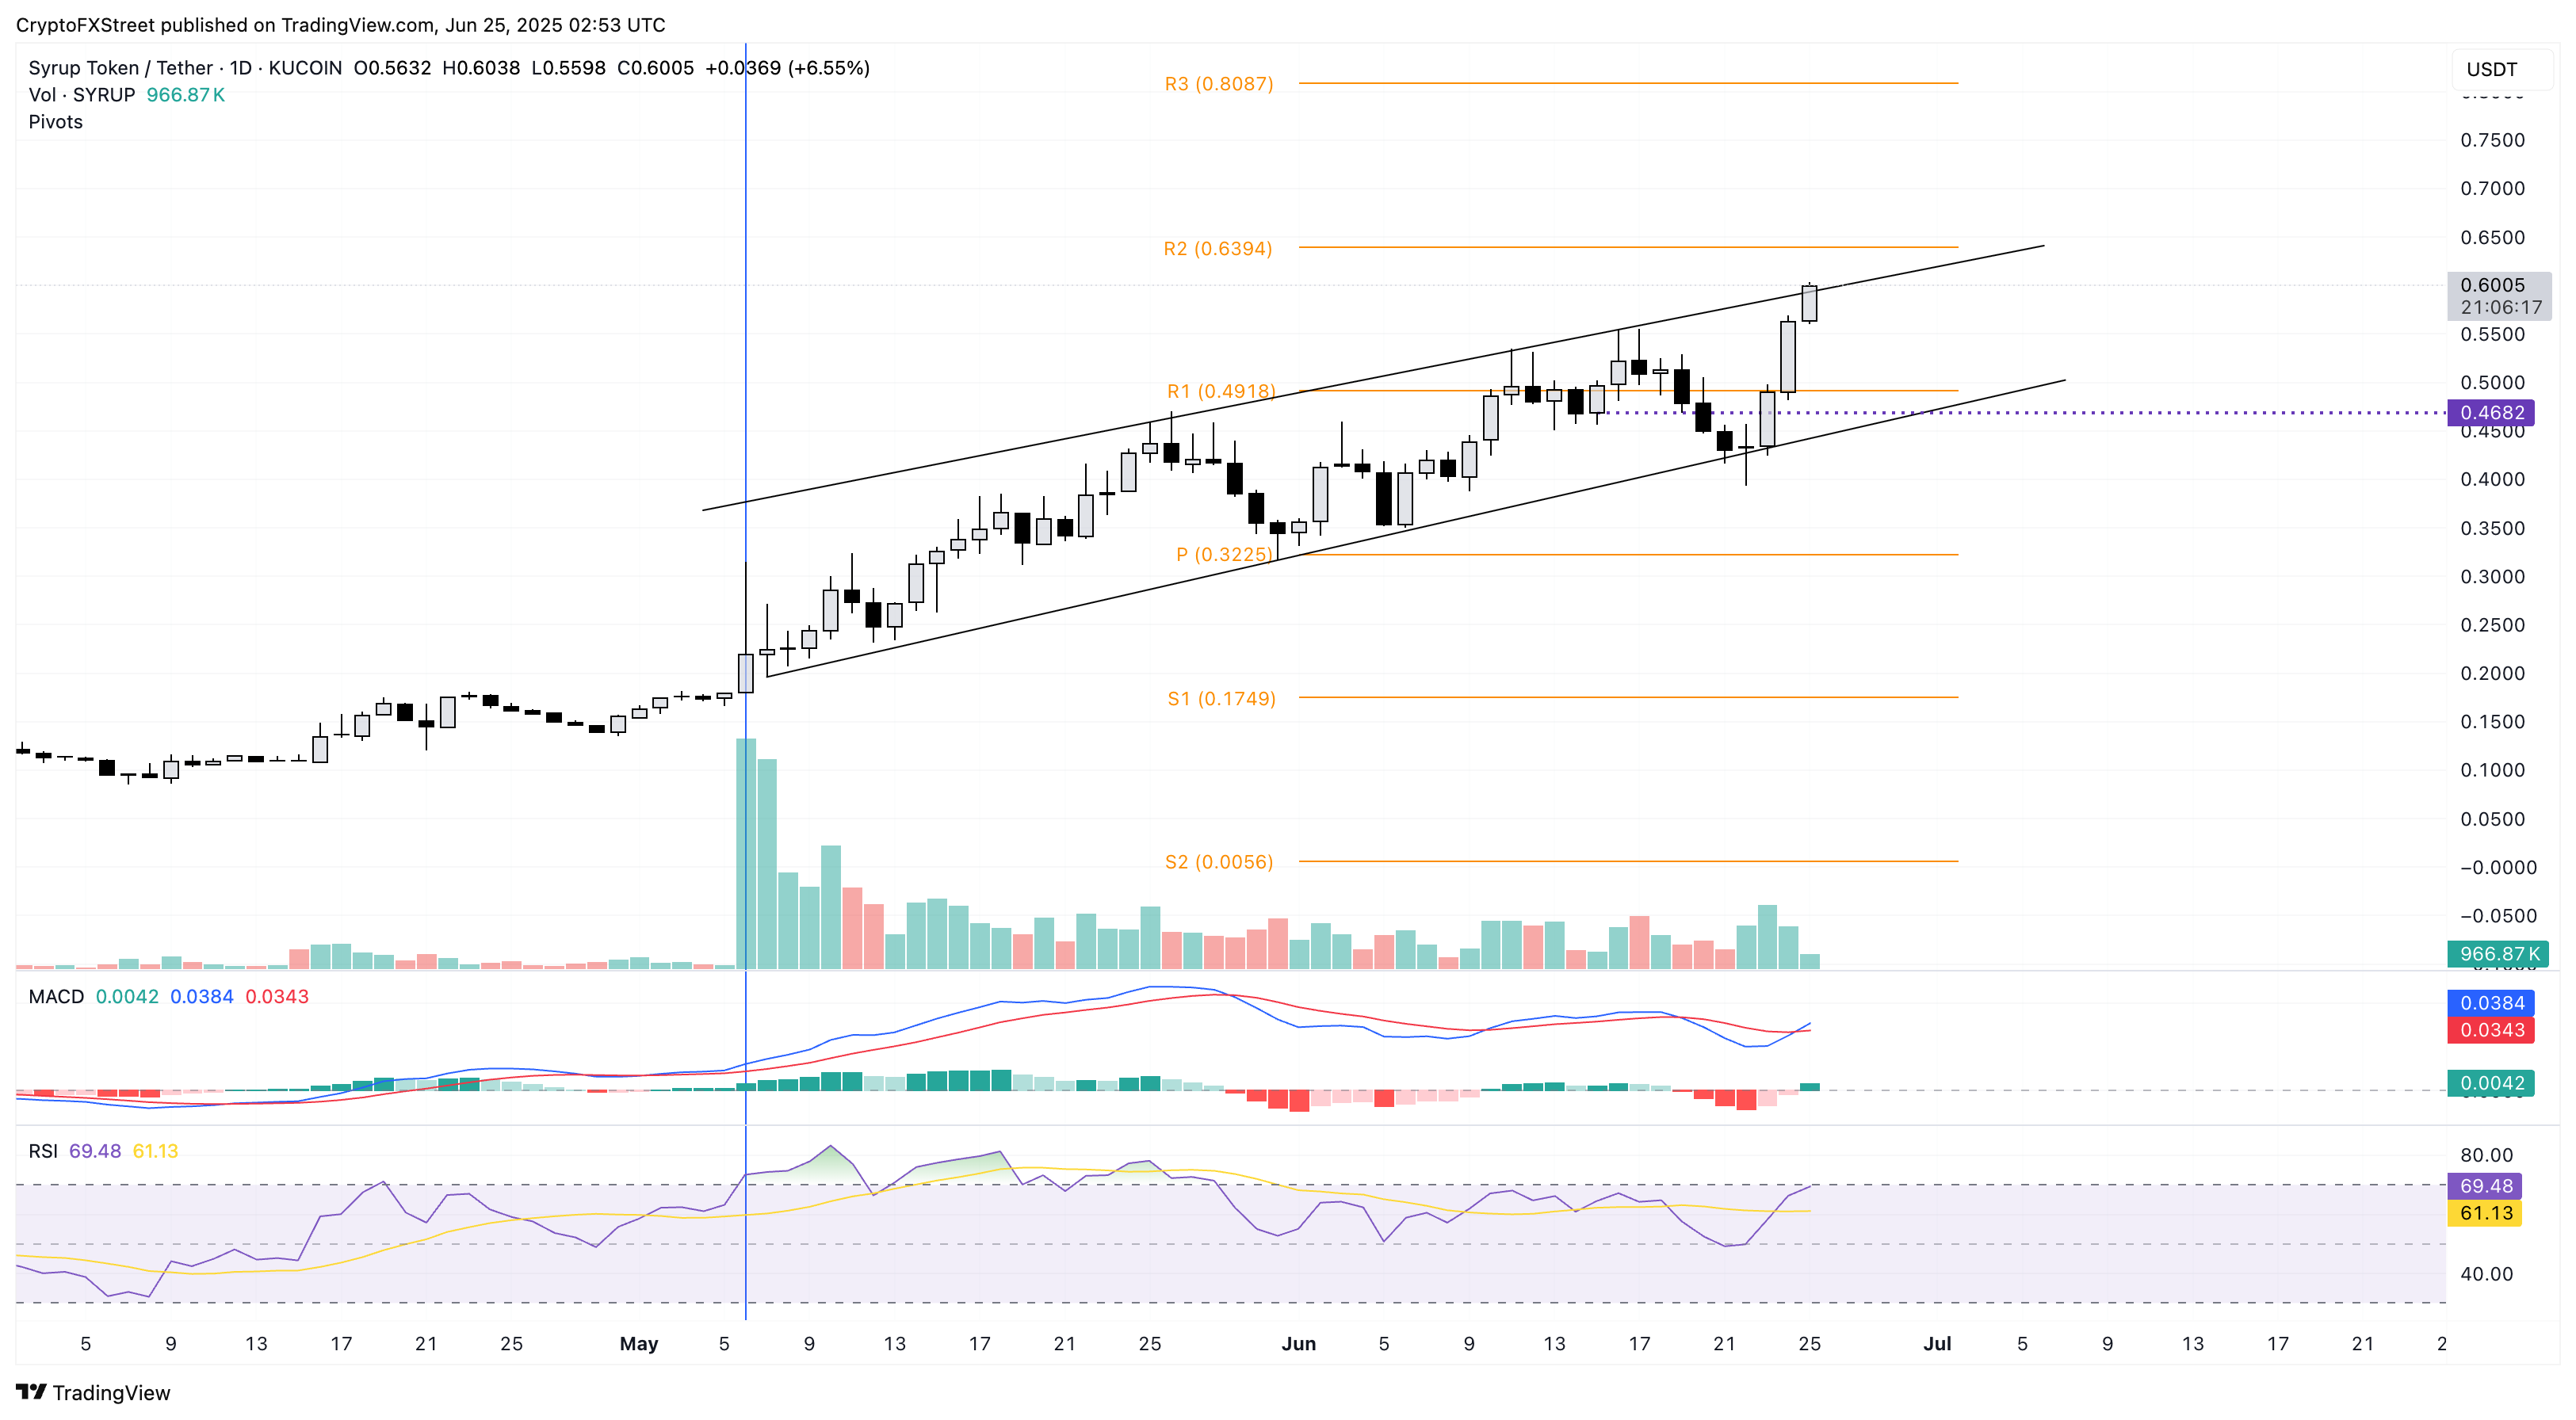
$SYRUP/$USDT daily price chart.
However, a closing below the trendline under $0.60 could reinforce a pullback within the channel towards the R1 level at $0.49.
Aptos recovery gains traction within a channel
Aptos edges lower by 1% at press time on Wednesday, a breather following the 28% surge on the previous two days. The rising demand for Made in America tokens propels $APT from a support trendline formed by the bottoms on February 3, April 6, and June 22.
Price action forms a falling channel pattern with an overhead parallel trendline extrapolated from March 2 and May 13. The short-term recovery in Aptos this week aims at the overhead trendline near $5.72.
The MACD indicator shows the MACD line crossing above its signal line, generally considered a buy signal for investors. Supporting the bullish thesis, the RSI indicates a rise in buying pressure as it takes a V-shaped reversal from the oversold boundary line.
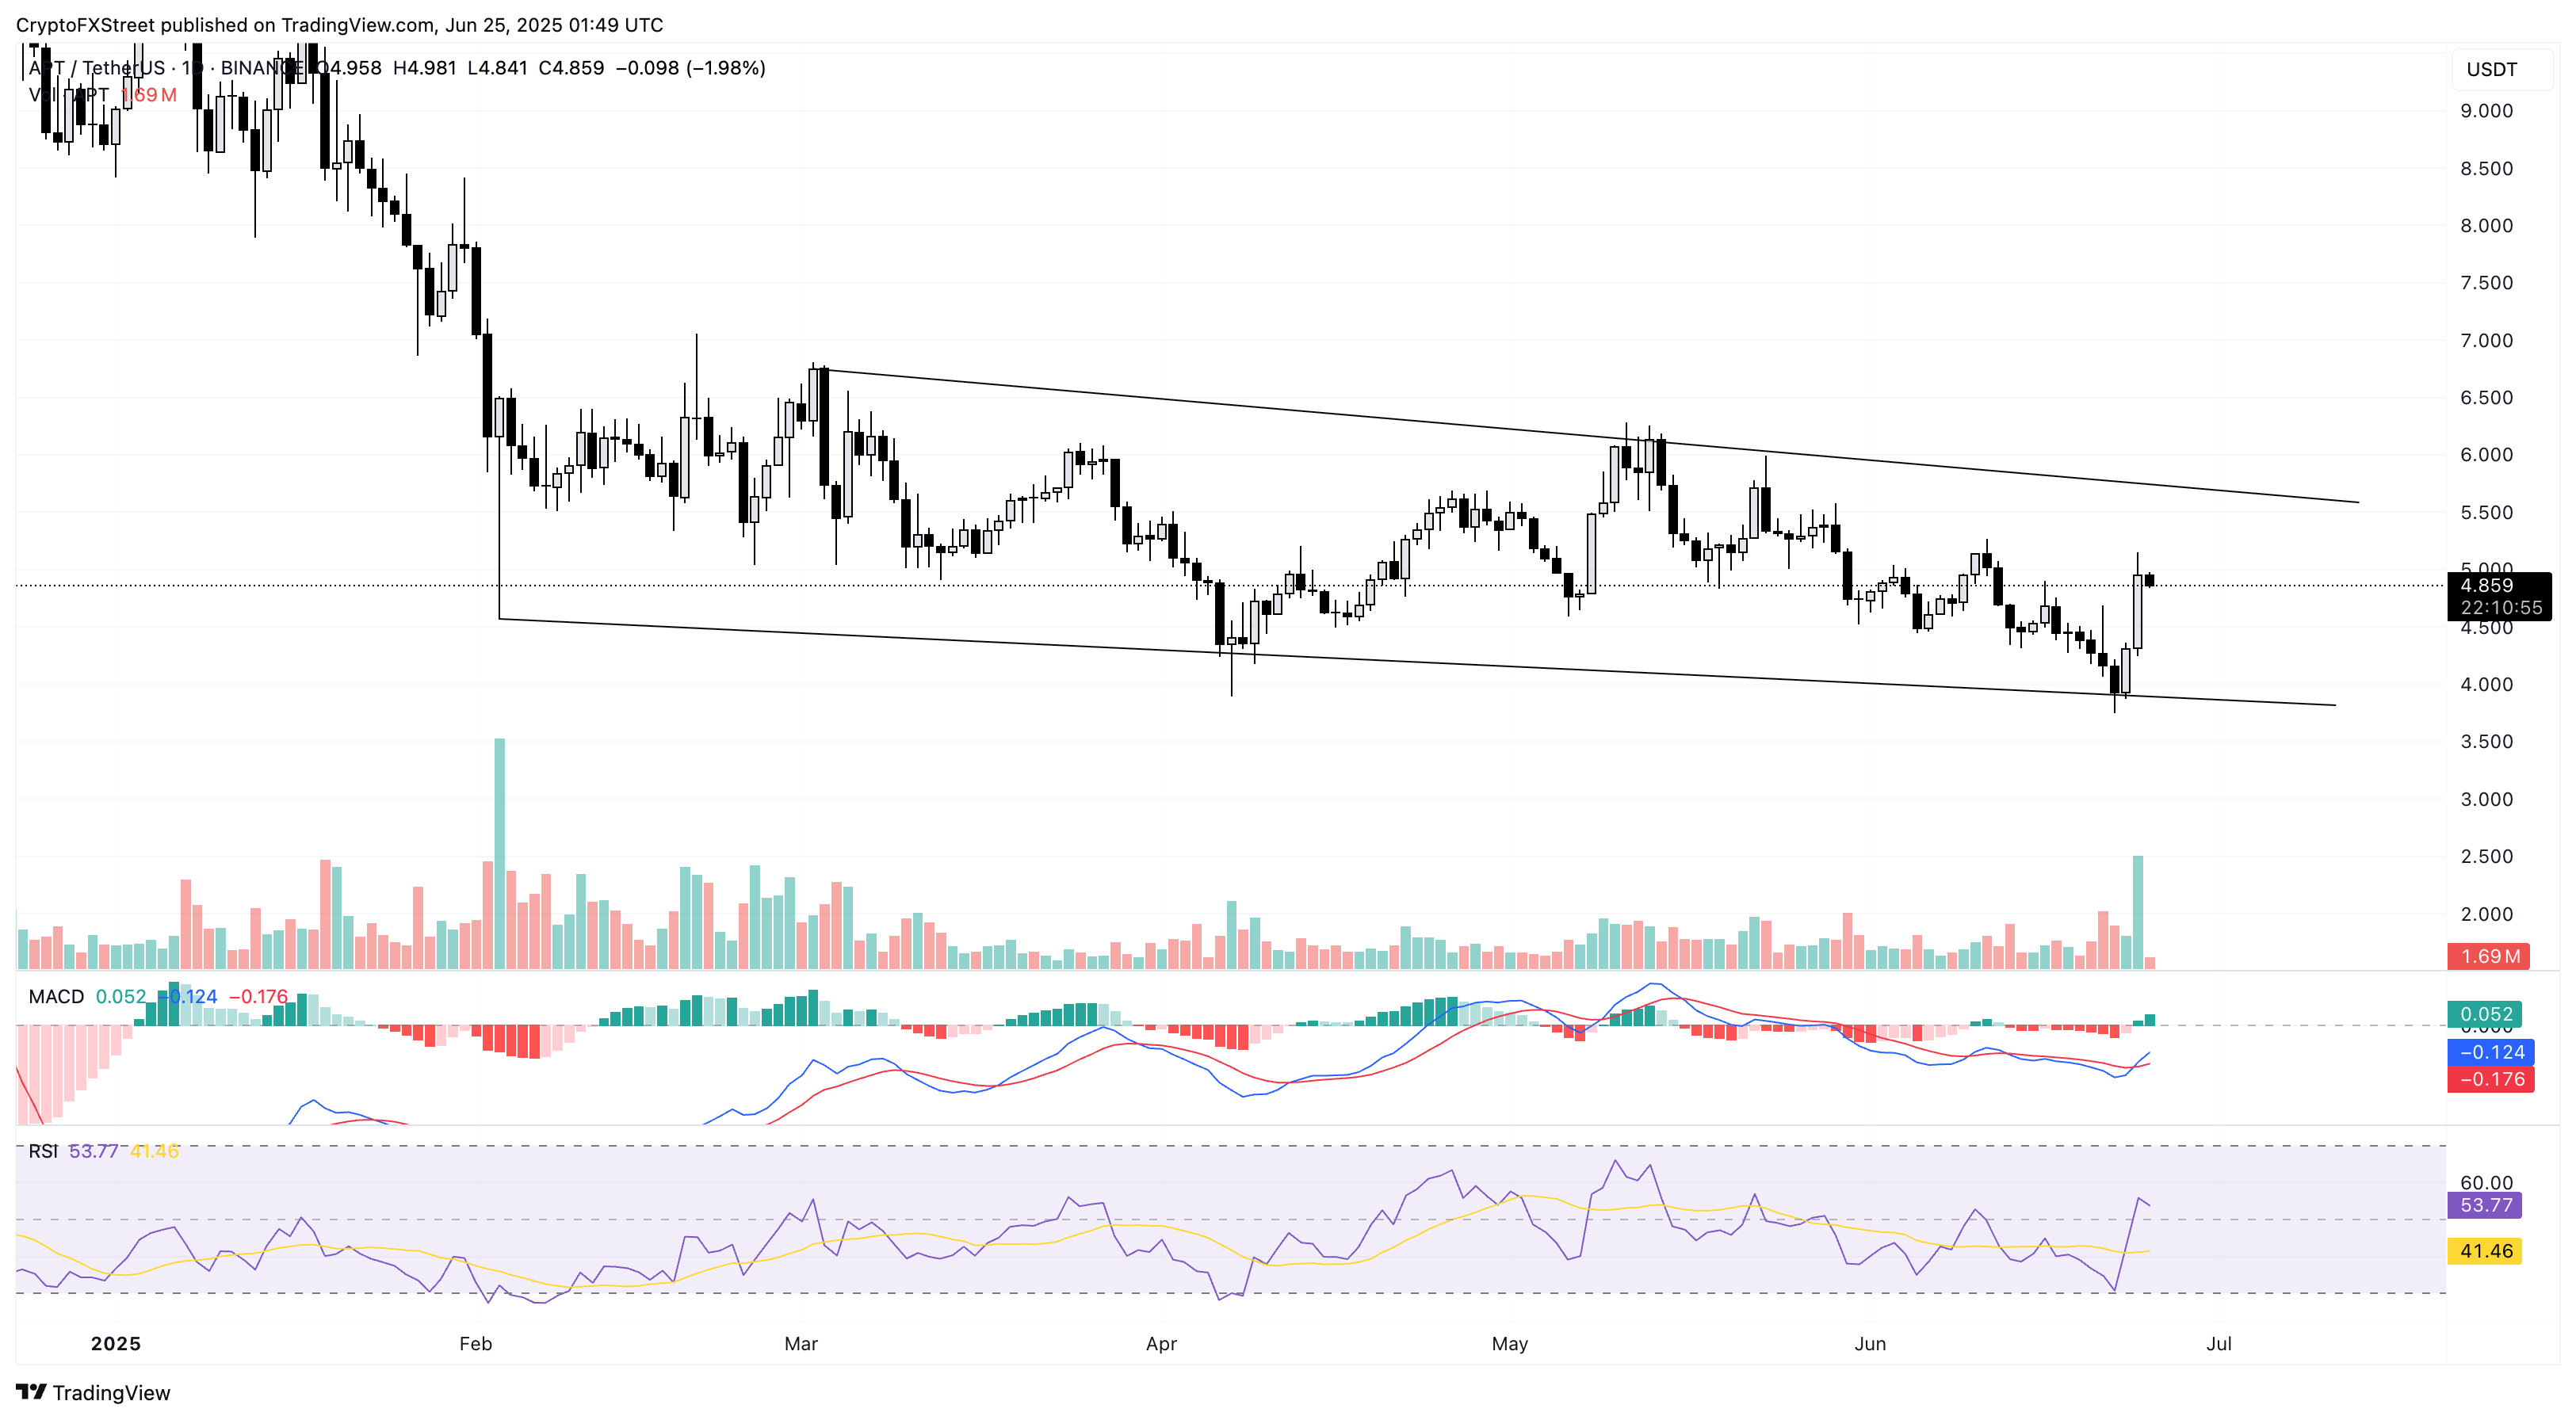
$APT/$USDT daily price chart.
On the flip side, a reversal could retest the lower boundary line near the weekly low at $3.87.