
- $OKB edges higher on Monday after three consecutive bearish days, undermining the pullback over the weekend.
- Story bounces off a falling channel’s support trendline, signaling a potential trend reversal.
- $HYPE edges higher on Monday, extending the weekend’s recovery stemming from a support trendline that has been held since April.
The broader cryptocurrency market experiences a surge in selling pressure as Bitcoin ($BTC) dips close to $100,000 at press time on Monday. Against this backdrop, the majority of top altcoins trade in the red while $OKB ($OKB), Story (IP), and Hyperliquid ($HYPE) hold bullish momentum.
At the time of writing, Bitcoin is trading lower for its fifth consecutive bearish day, as bulls struggle to hold above $100,000 following the 24-hour low of $98,200 on Sunday. A close below $100,000 could send $BTC crashing towards Sunday’s low, extending the broader market's downfall.
Alternatively, a hold-off at the psychological level could increase cases of altcoins rising against the bearish tide.
$OKB’s trend reversal gains strength
$OKB records a jump of over 6% at press time on Monday, marking a bullish start to the week. With a bullish engulfing candle forming, $OKB undermines the three-day drop, testing the $50 psychological support level.
A close above $53.88 will mark a new high daily close price in June, potentially extending the uptrend towards $56.17, last tested on May 10.
Turning to momentum indicators, the Moving Average Convergence/Divergence (MACD) indicator nears its signal line for a bullish crossover, indicating a potential trend reversal.
The Relative Strength Index (RSI) at 55 takes another sharp reversal, crossing above the halfway line, which projects a resurgence of bullish momentum. The indicator supports upside potential with room for growth before reaching the overbought conditions.
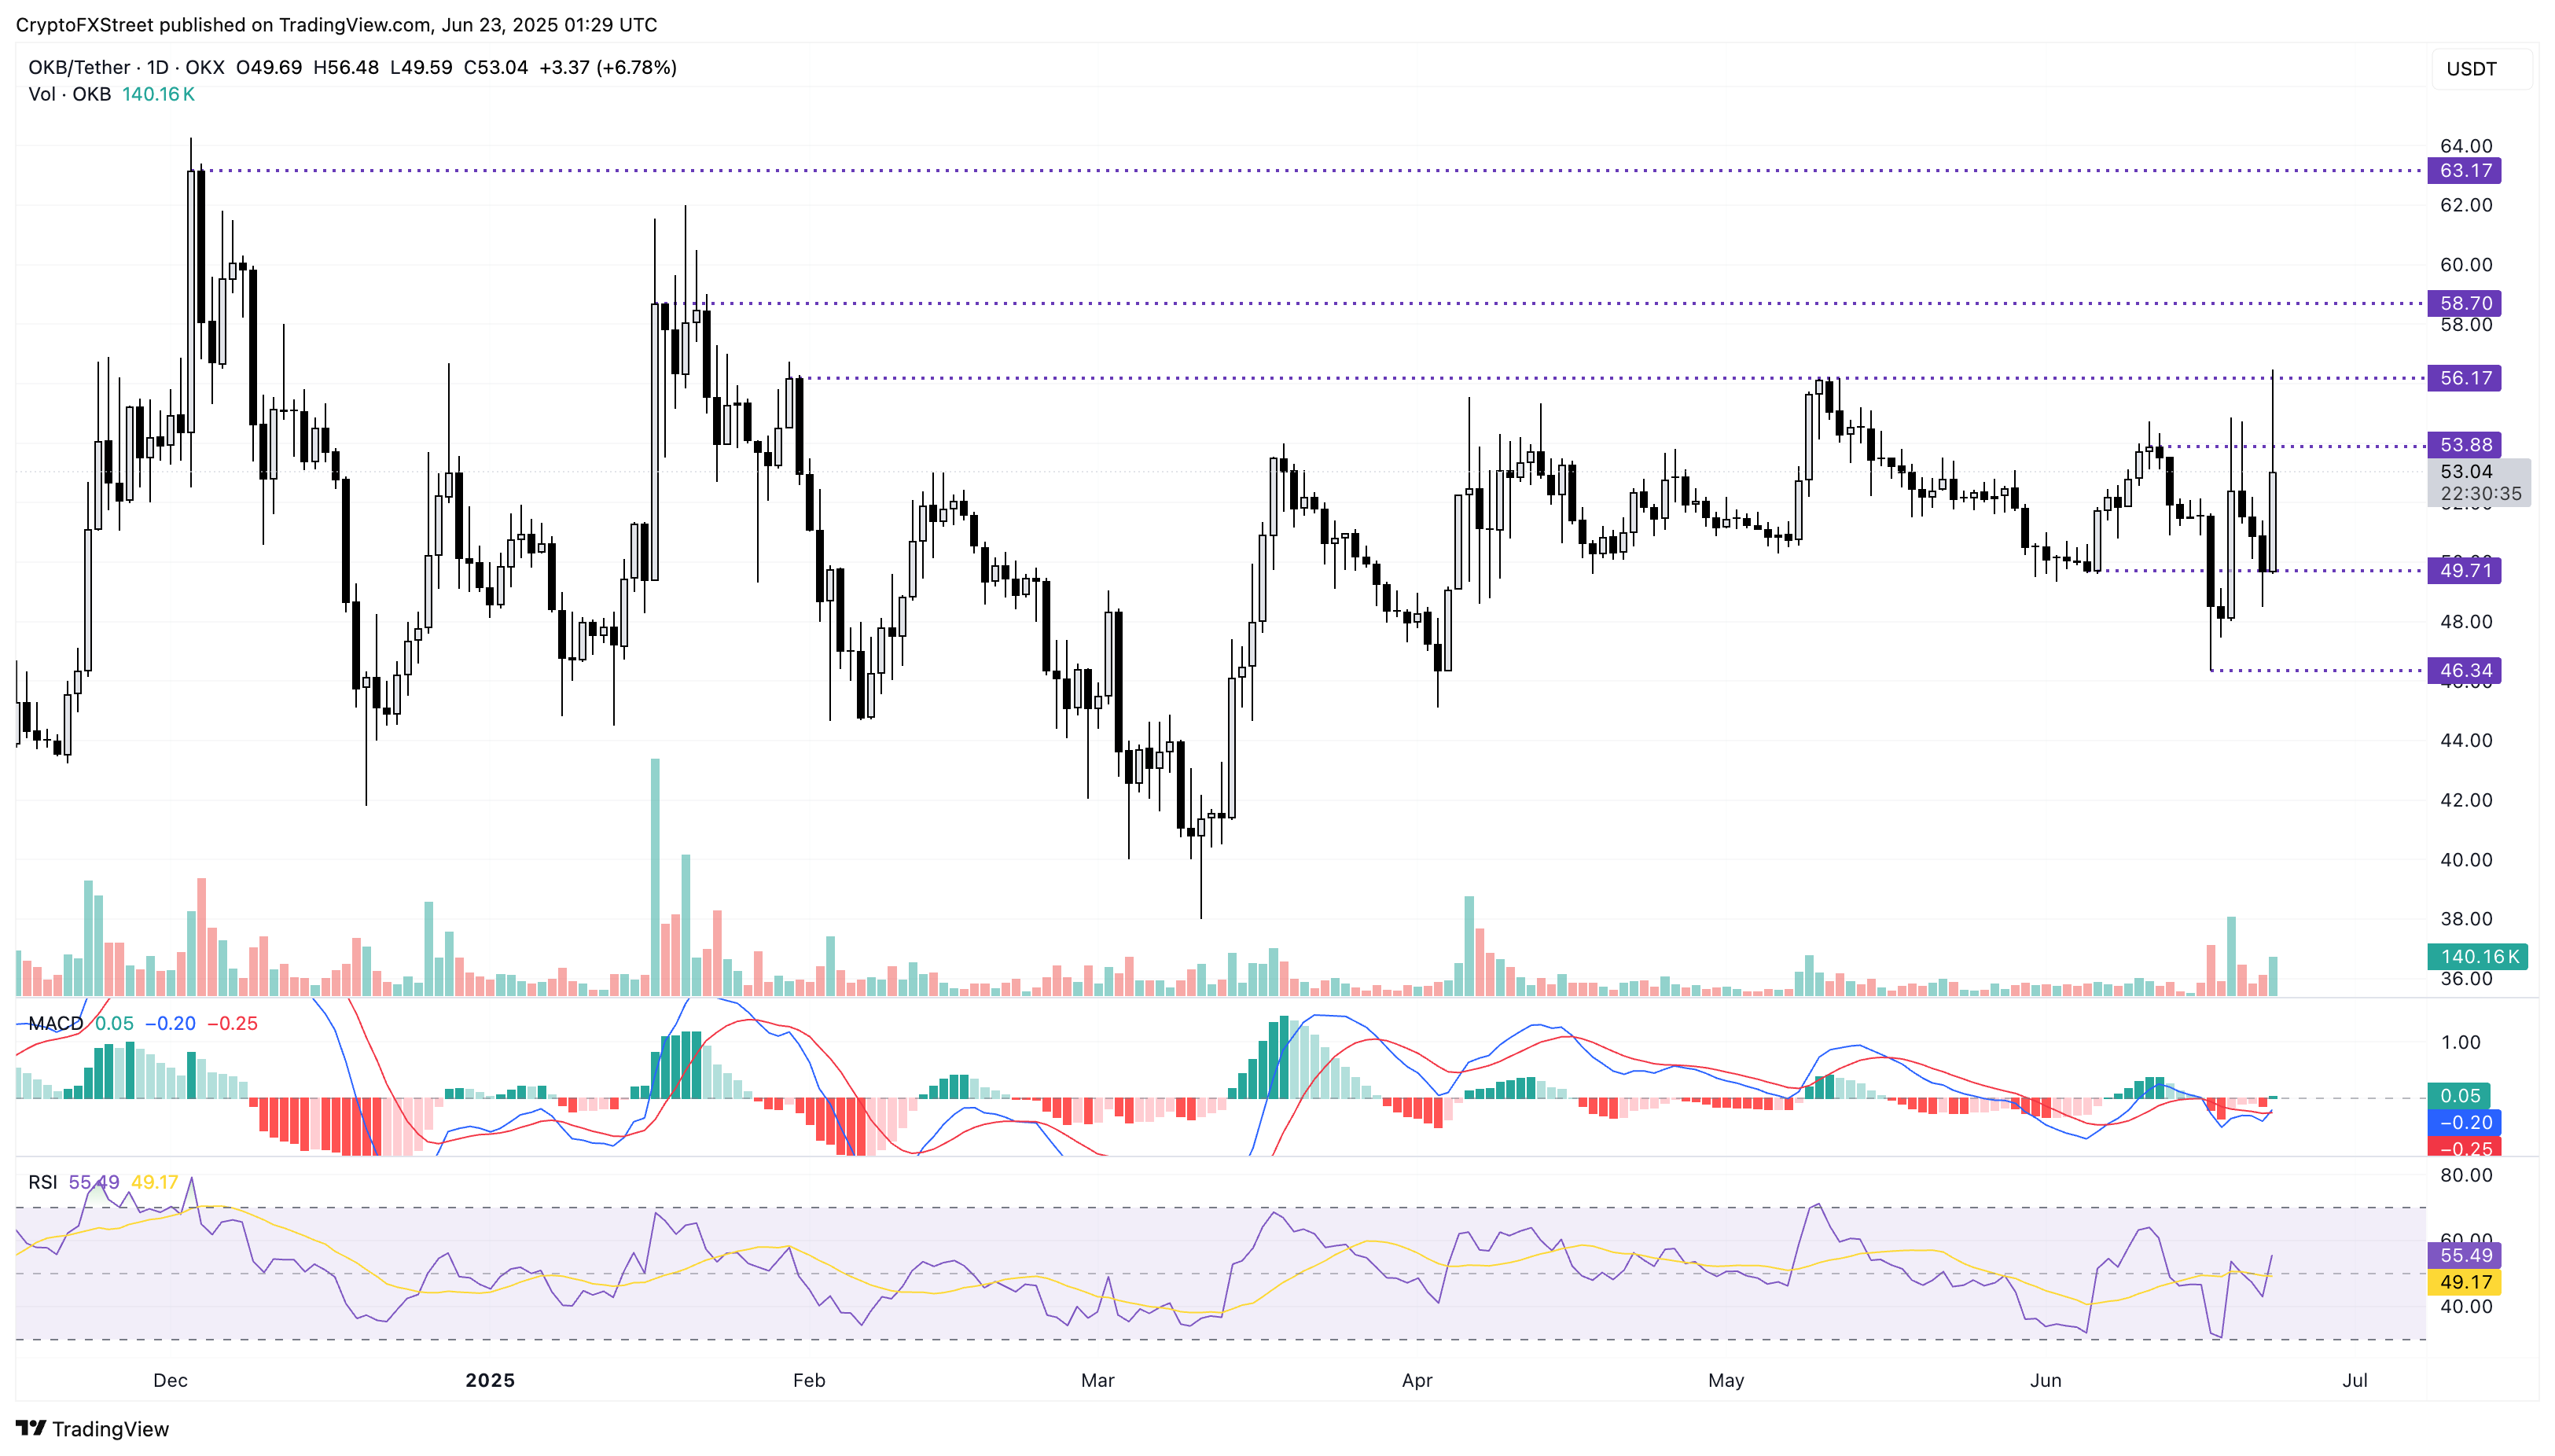
$OKB/$USDT daily price chart.
However, the 24-hour high at $56.48 creates a long upper shadow as seen in the bearish reversal last week. A failure to close above $53.88 could prolong a sideways trend.
Story to bounce back within a falling channel
Story edges higher by 10%, crossing the $3 mark at press time on Monday, suggesting a trend reversal from a support trendline formed by the lows on March 7, April 7, and June 19. To put a falling channel in perspective, a resistance trendline formed by lower highs on February 26, March 25, May 11, and May 22 runs parallel to the support trendline.
Story targets the upper trendline near $3.78, aligned with the closing price on May 30.
The MACD indicator reverses within the negative territory, concurrent with the declining red histogram bars. A potential bullish crossover between the MACD and signal lines, with bullish histograms rising above the zero line, is considered a buy signal.
The RSI at 38 springs from the oversold zone, signaling a boost in bullish momentum and a potential upswing within the channel before it reaches overbought conditions.
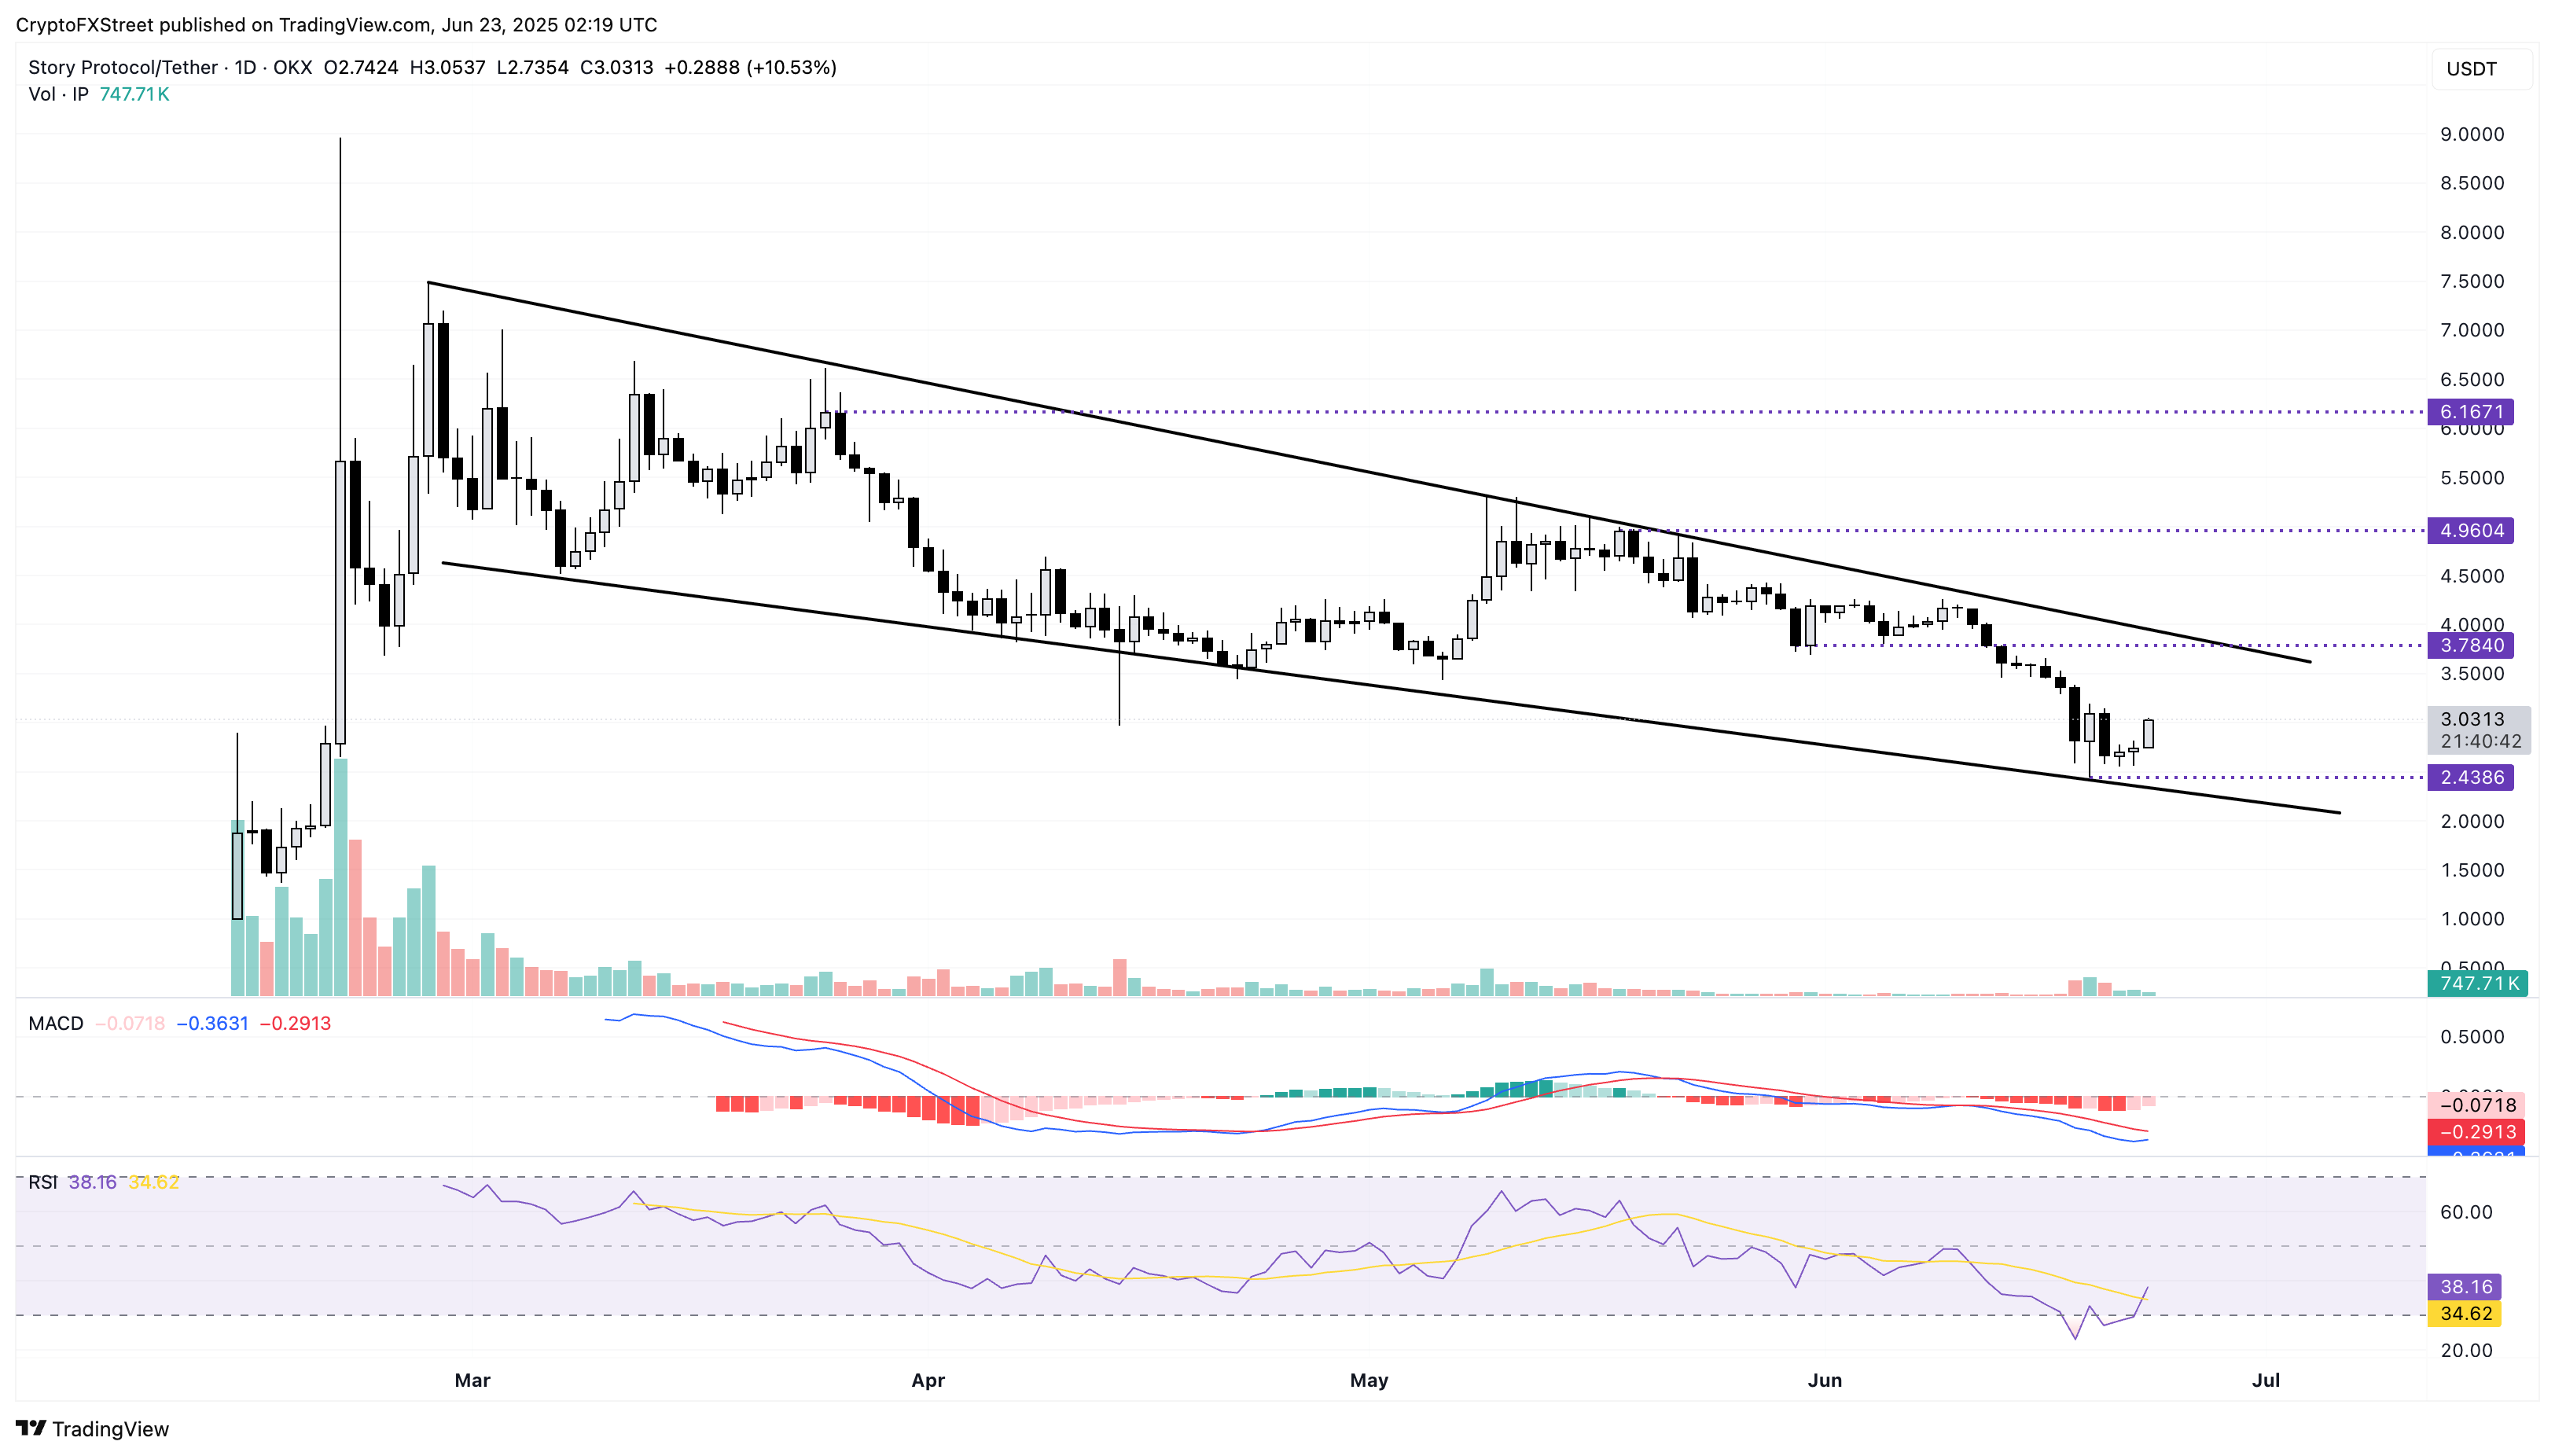
IP/$USDT daily price chart.
If Story loses the intraday gains, it could retest last week’s low at $2.43.
$HYPE regains bullish momentum at key trendline
Hyperliquid reports a minor growth of under 1% at the time of writing on Monday. $HYPE marks the third consecutive bullish candle, extending the 7% weekend recovery.
A support trendline formed higher lows on April 7, April 28, May 6, and June 20. The immediate resistance for $HYPE aligns with the May 25 swing high at $39.05.
The MACD indicator inches closer towards its signal line for a bullish crossover, considered a trend reversal and buy signal. The RSI at 49 reverses towards the halfway line as bullish momentum replenishes, indicating a potential uptrend continuation.
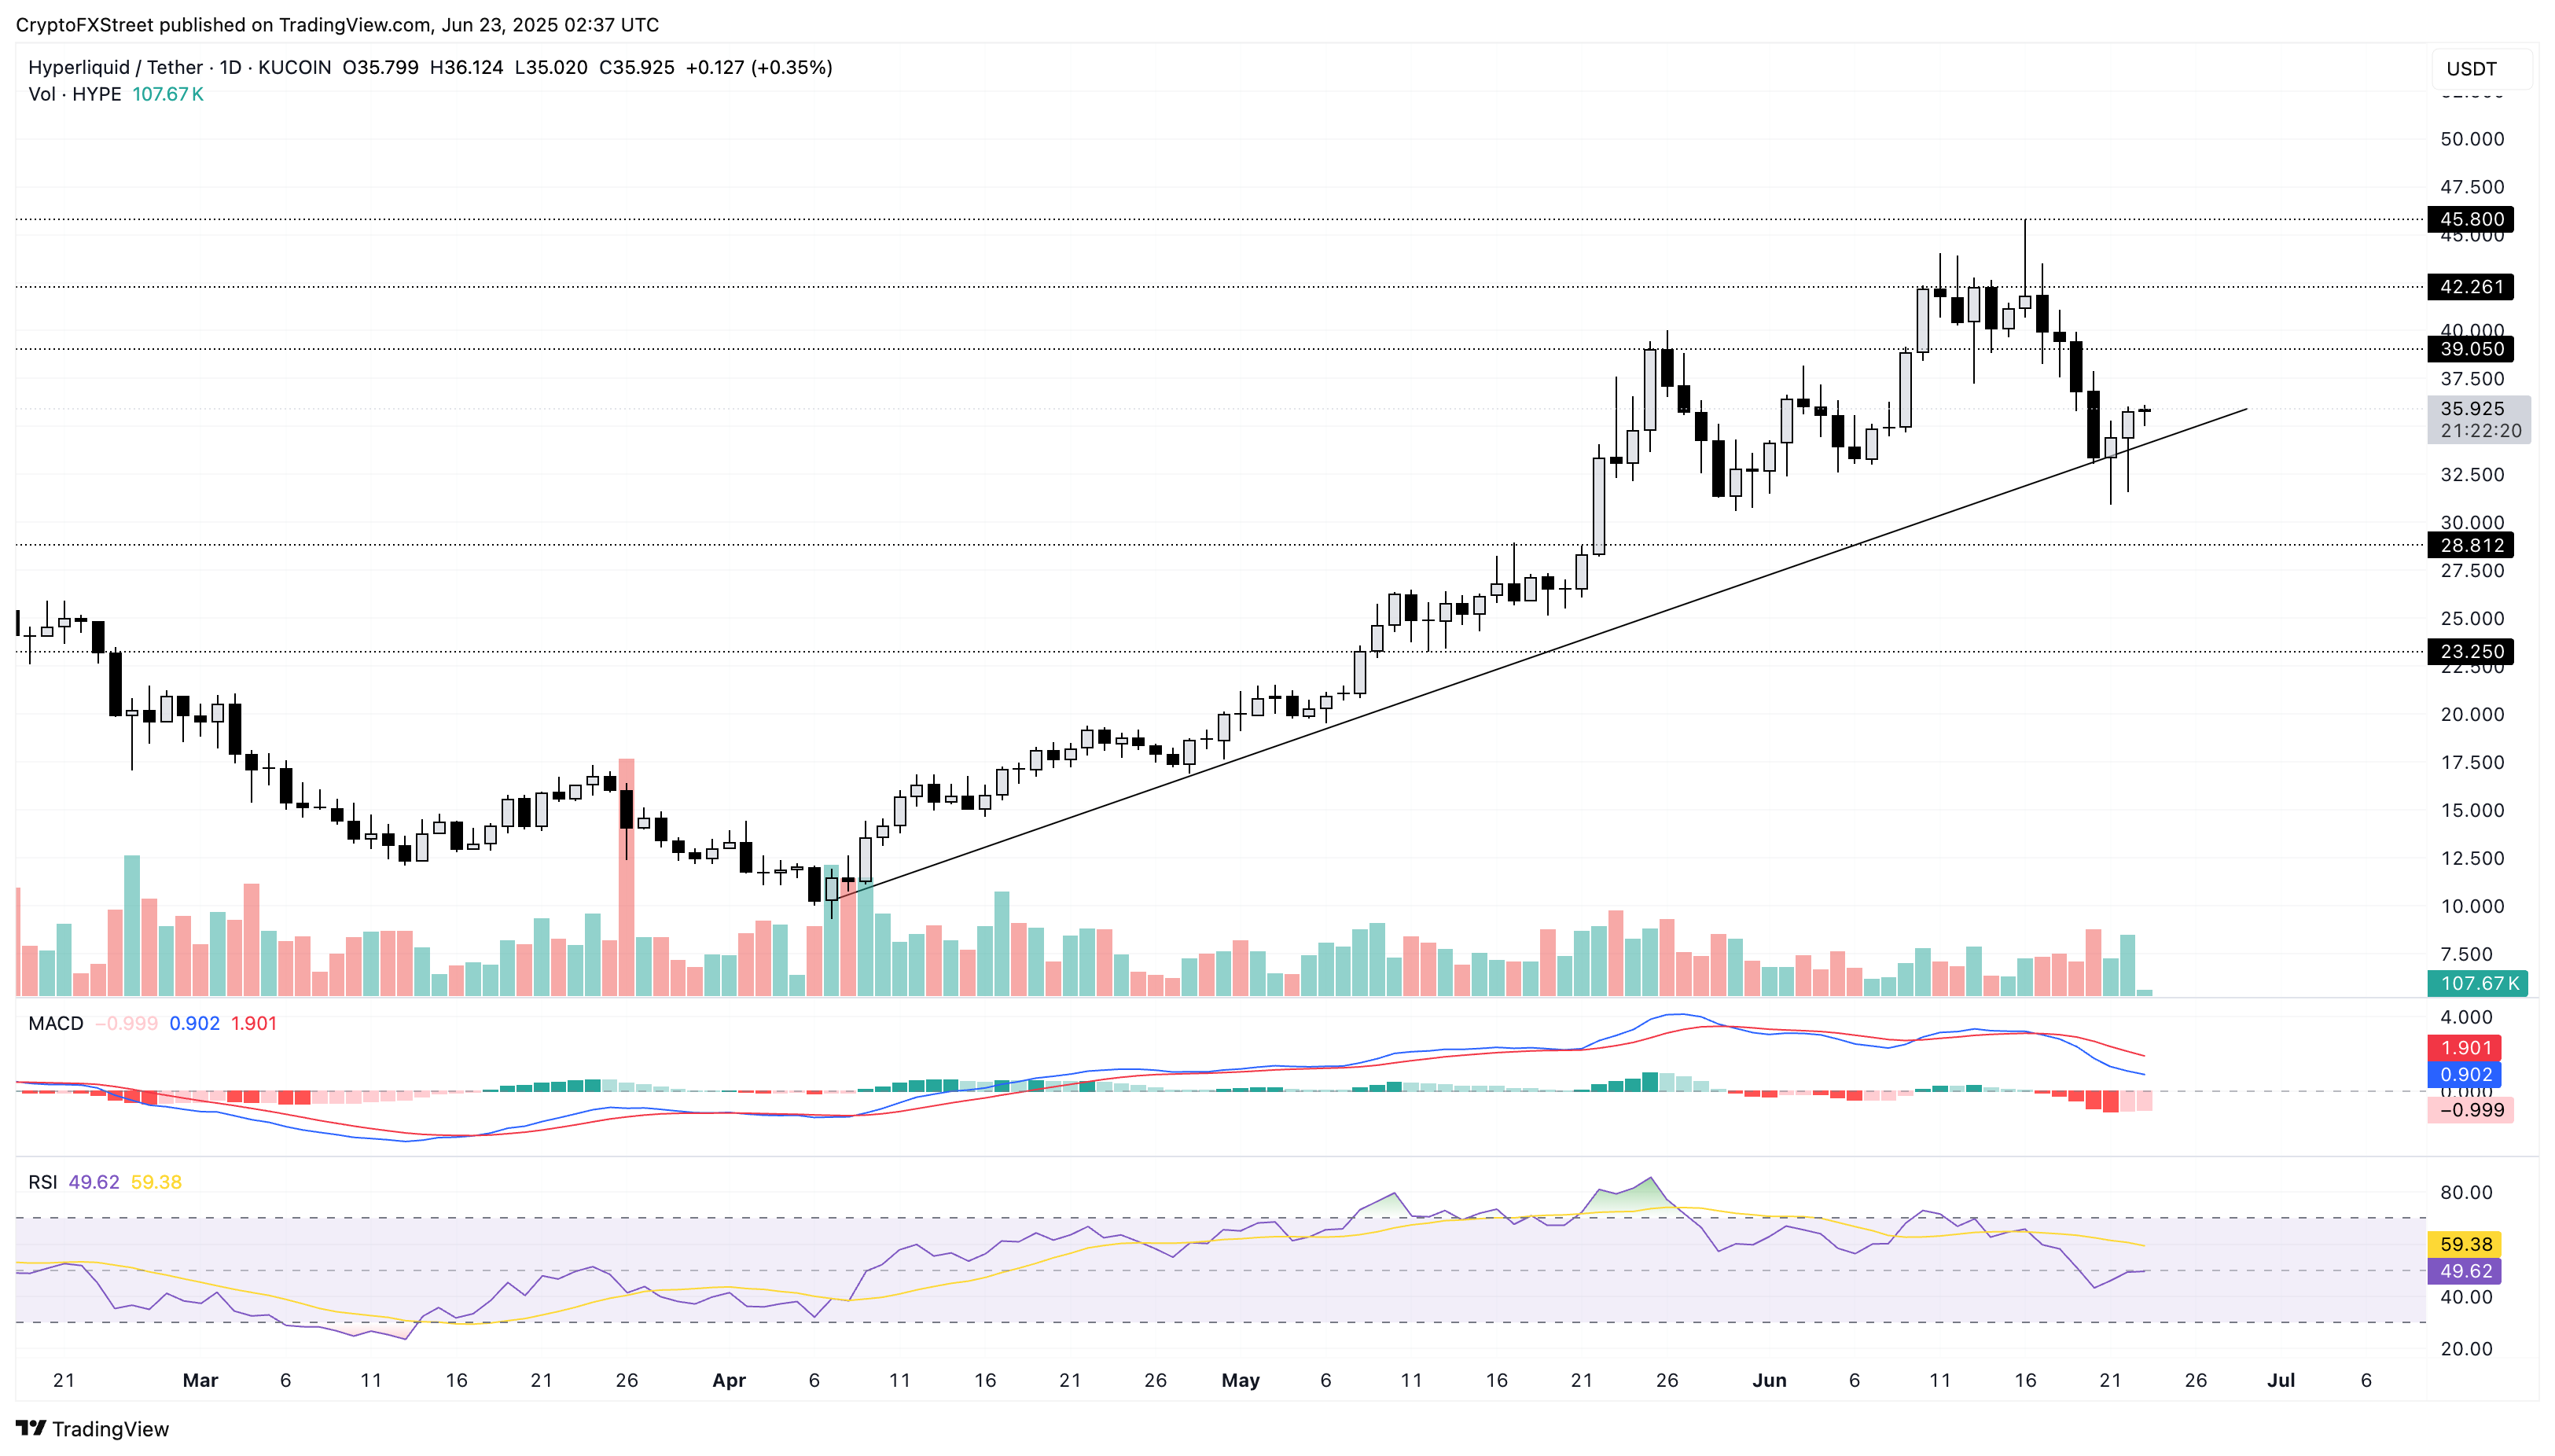
$HYPE/$USDT daily price chart.
However, if $HYPE closes under the support trendline, aligning with Sunday’s opening price at $34.40, it could extend the decline to $28.81, last tested on May 17.