
- Raydium price is rallying by more than 18% on Thursday after finding support around its $2 psychological level.
- South Korea’s largest cryptocurrency exchange, Upbit, lists $RAY trading pairs on Thurday.
- CoinGlass Open Interest data for $RAY reaches $32.48 million, the highest level since mid-May.
Raydium ($RAY) price rallies more than 18% on Thursday after rebounding from its key support the previous day. The main reason for $RAY’s rally is that Upbit, South Korea’s largest cryptocurrency exchange, announced the listing of $RAY trading pairs. Derivatives data also support the bullish thesis as $RAY’s Open Interest (OI) rose and reached levels not seen since mid-May.
Why is Raydium rallying today?
Raydium price soared more than 18% during the early Asian trading session on Thursday. The main reason for this price surge is that South Korea’s largest cryptocurrency exchange, Upbit, has announced that it will list $RAY/KRW and $RAY/$USDT trading pairs. Trading will open at noon (local time) on June 19.
This announcement fueled the rally in $RAY, as listing on exchanges increases liquidity, exposure and credibility for the token, bolstering its bullish outlook.

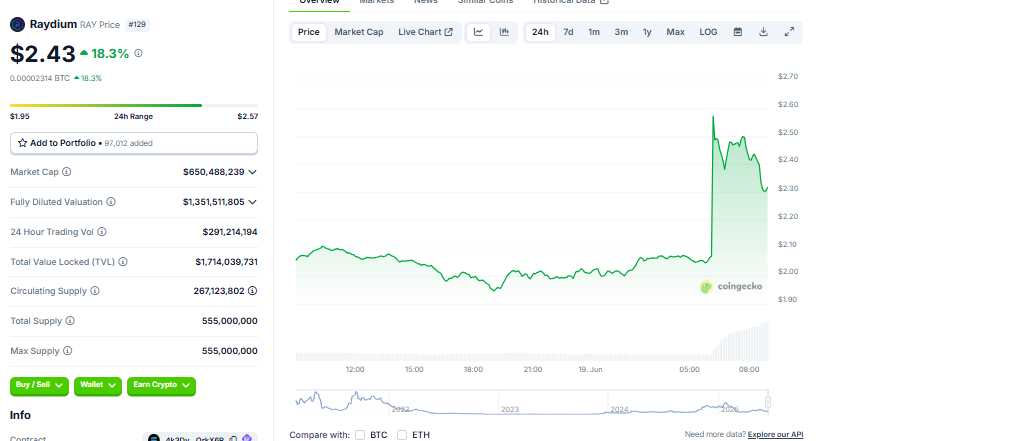
$RAY chart. Source: CoinGecko
Looking down on its derivatives data further supports the rally. CoinGlass’ data shows that the futures’ OI in $RAY at exchanges rose from $17.49 million on Wednesday to $32.48 million on Thursday, nearly twice the previous level in one day and the highest since mid-May. An increasing OI represents new or additional money entering the market and new buying, which suggests a rally ahead in the Raydium price.
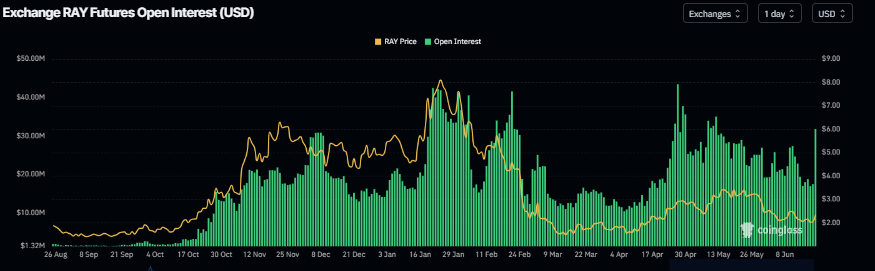
$RAY Open Interest chart. Source: Coinglass
Raydium’s psychological level remains strong
Raydium price retested and found support around its key psychological level of $2 on Wednesday. At the time of writing on Thursday, it traded higher by 15.65%, around $2.38.
If $RAY continues its upward trend and closes above the 50-day Exponential Moving Average (EMA) at $2.52 on a daily basis, it could extend the rally toward its next daily resistance at $3.05.
The Relative Strength Index (RSI) on the daily chart read 49 points upward, toward its neutral level of 50, indicating a fading of bearish momentum. For the bullish momentum to be sustained, the RSI must move above its neutral level. The Moving Average Convergence Divergence (MACD) is also flipping a bullish crossover on the daily chart. If it flips to a bullish crossover, it would give a buying signal and indicate an upward trend.

$RAY/$USDT daily chart
However, if $RAY faces a correction, it could extend the decline to retest its key psychological level at $2.