
- Raydium records an over 15% surge on Thursday, leading the broader market recovery.
- Aerodrome Finance eyes further gains as a double-digit jump breaks above a critical resistance.
- The SPX6900 meme coin surges from a crucial support level while momentum indicators flash a warning signal.
Decentralized Finance (DeFi) tokens, such as Raydium ($RAY) and Aerodrome Finance ($AERO), alongside SPX6900 ($SPX), outperformed the broader cryptocurrency market over the last 24 hours, following the Federal Reserve's decision to keep the policy rates unchanged at 4.25%-4.5% in the June policy meeting.
With the fourth consecutive meeting keeping federal fund rates unchanged, top cryptocurrencies face pressure, as Bitcoin (BTC), Ethereum (ETH), and $XRP ($XRP) trade in the red, with losses of under 1% on Thursday.
Raydium springs back from $2
Raydium trades in the green by over 15% at press time on Thursday, as it bounces off the $2.00 psychological support level. The price action offers a double bottom reversal on the daily chart with a neckline at $2.58.
A clean push closing above the neckline could turbocharge Raydium’s recovery toward the 200-day Exponential Moving Average (EMA) at the $3.00 round figure.
The Moving Average Convergence/Divergence (MACD) indicator reverses upside and flashes a buy signal as it surpasses its signal line, known as a bullish crossover. The growth of a positive histogram from the zero line signals potential trend reversal in Raydium.
The Relative Strength Index (RSI) at 50 has spiked to the halfway level from the oversold zone, signaling a boost in bullish momentum.
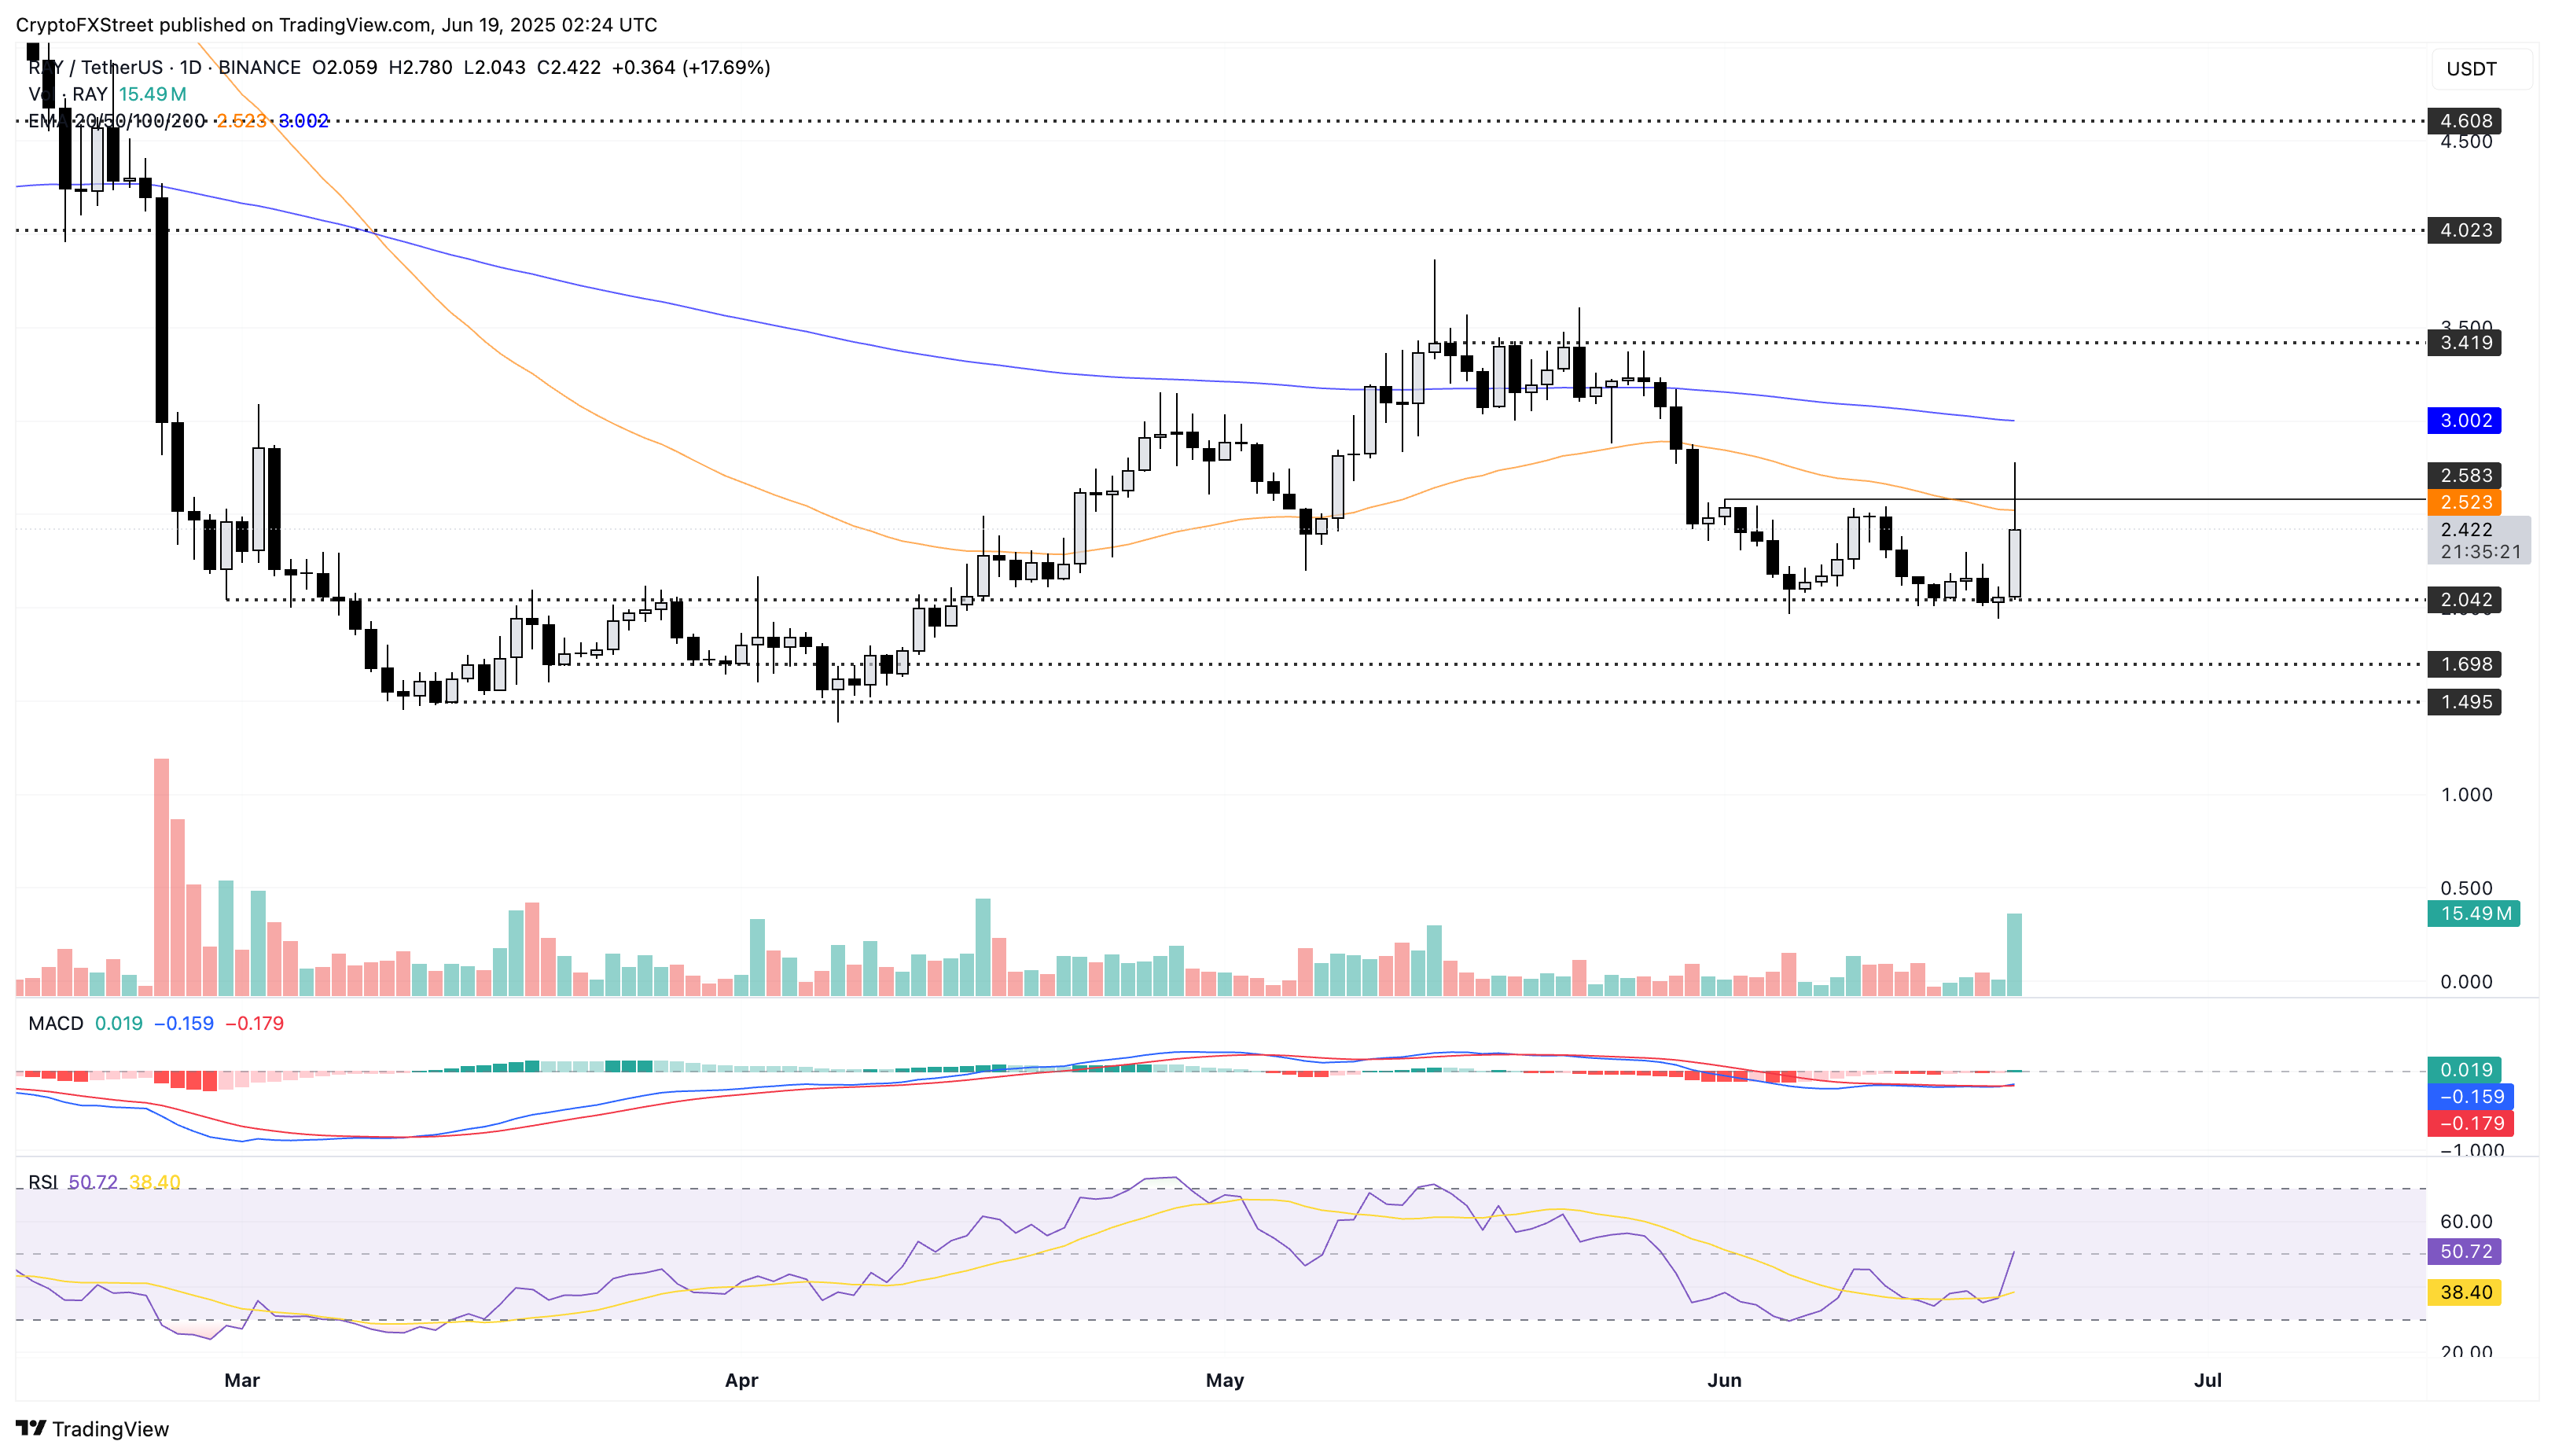
$RAY/$USDT daily price chart.
On the contrary, a failure to close above the double bottom’s neckline could revert $RAY towards the $2.00 mark.
$AERO targets extended gains towards $1
$AERO edges higher by 3% at the time of writing, following the previous day’s 19% surge. The DeFi token surpasses the 200-day (EMA) and records its highest traded price in over four months.
$AERO marks a concrete closing above $0.81 aligned with the 50% Fibonacci level, drawn from the all-time high of $2.33 to the year-to-date low of $0.282. The immediate resistance lies at $1.04, aligned with the 61.8% Fibonacci level.
The positive trend in the MACD indicator, with rising green histograms, indicates a strengthening of bullish momentum. However, the RSI line nears the overbought zone, gradually increasing the risk of a pullback.
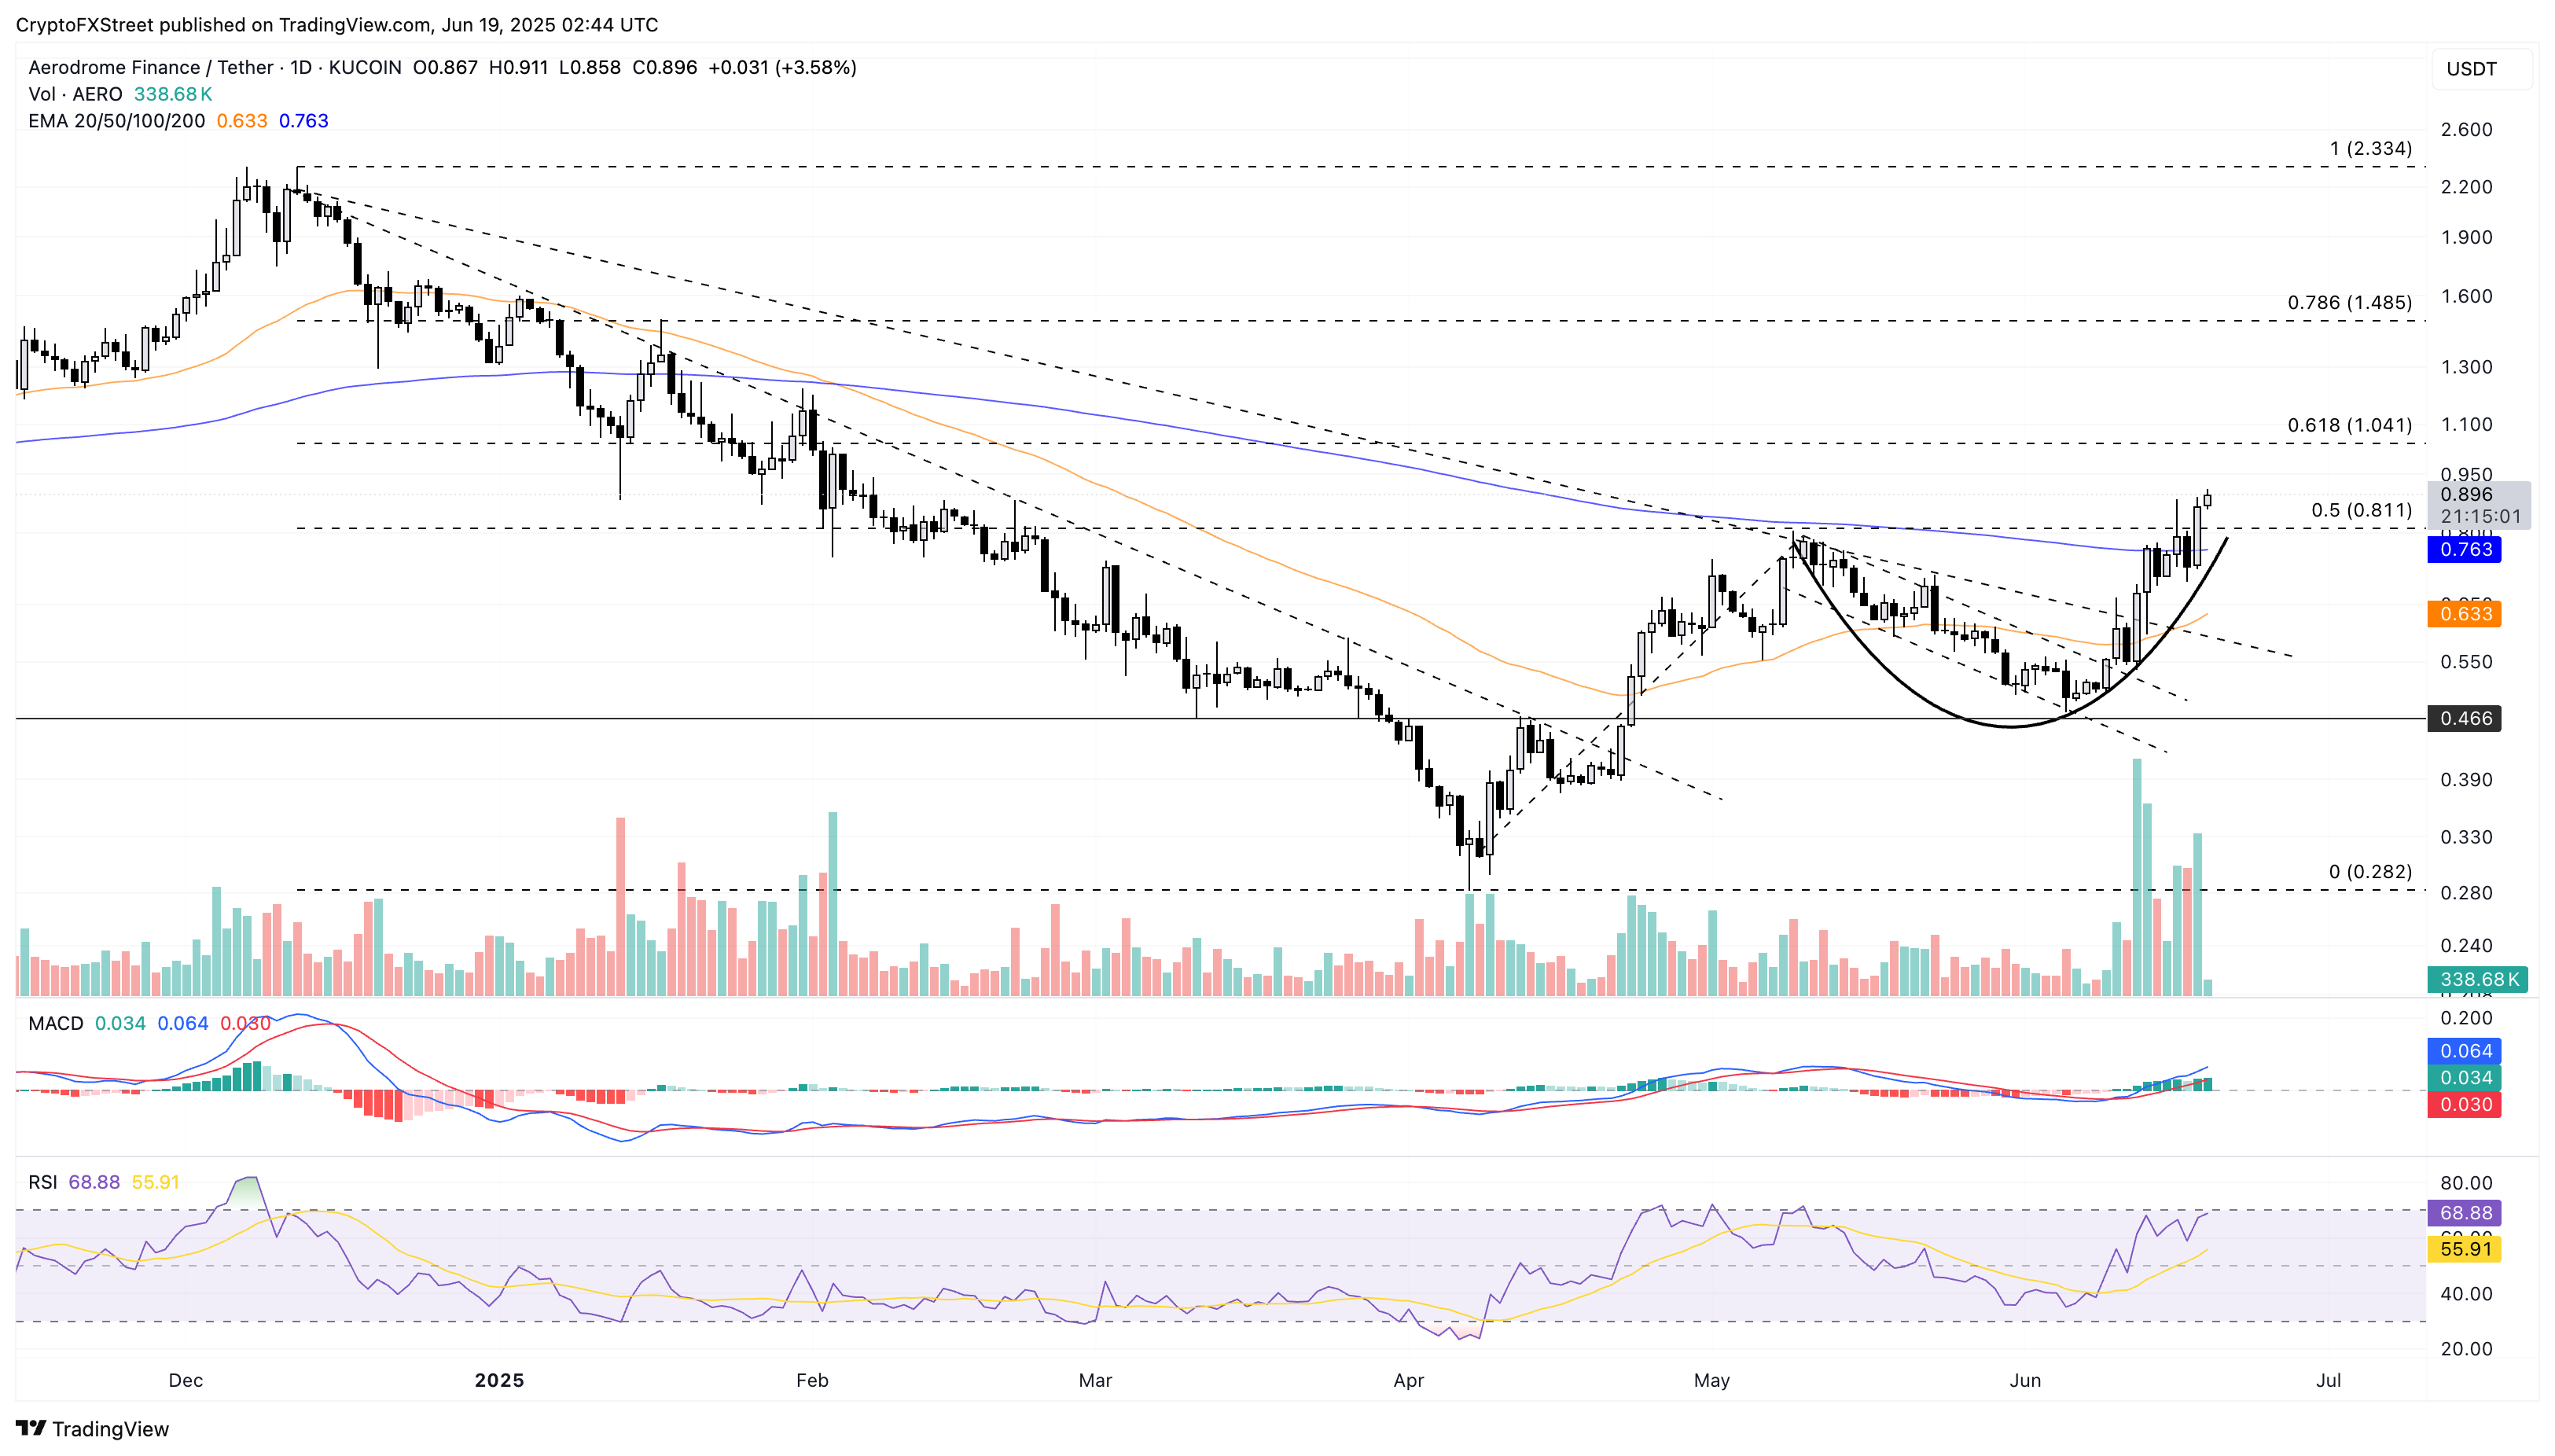
$AERO/$USDT daily price chart.
On the flip side, a reversal below the 50% Fibonacci could nullify upside chances, risking a 50-day EMA retest at $0.63.
$SPX recovery warns of a dead cat bounce performance
In a show of underlying strength, the SPX6900 meme coin surged by 13% on Wednesday, undermining the previous day’s 12% pullback. At the time of writing, $SPX edges lower by over 1% on Thursday, indicating a breather phase.
The meme coin faces opposition at the $1.47 support level, aligned with the 78.6% Fibonacci retracement drawn from the all-time high of $8.03 to the year-to-date low of $0.25. Closing above this could drive $SPX toward its all-time high.
However, the increased volatility since last week triggers a bearish crossover in the MACD indicator as it drops below its signal line. A new wave of red histogram bars below the zero line indicates a looming trend reversal.
Similarly, the RSI at 59, reversing from the overbought zone, indicates a loss of bullish momentum.
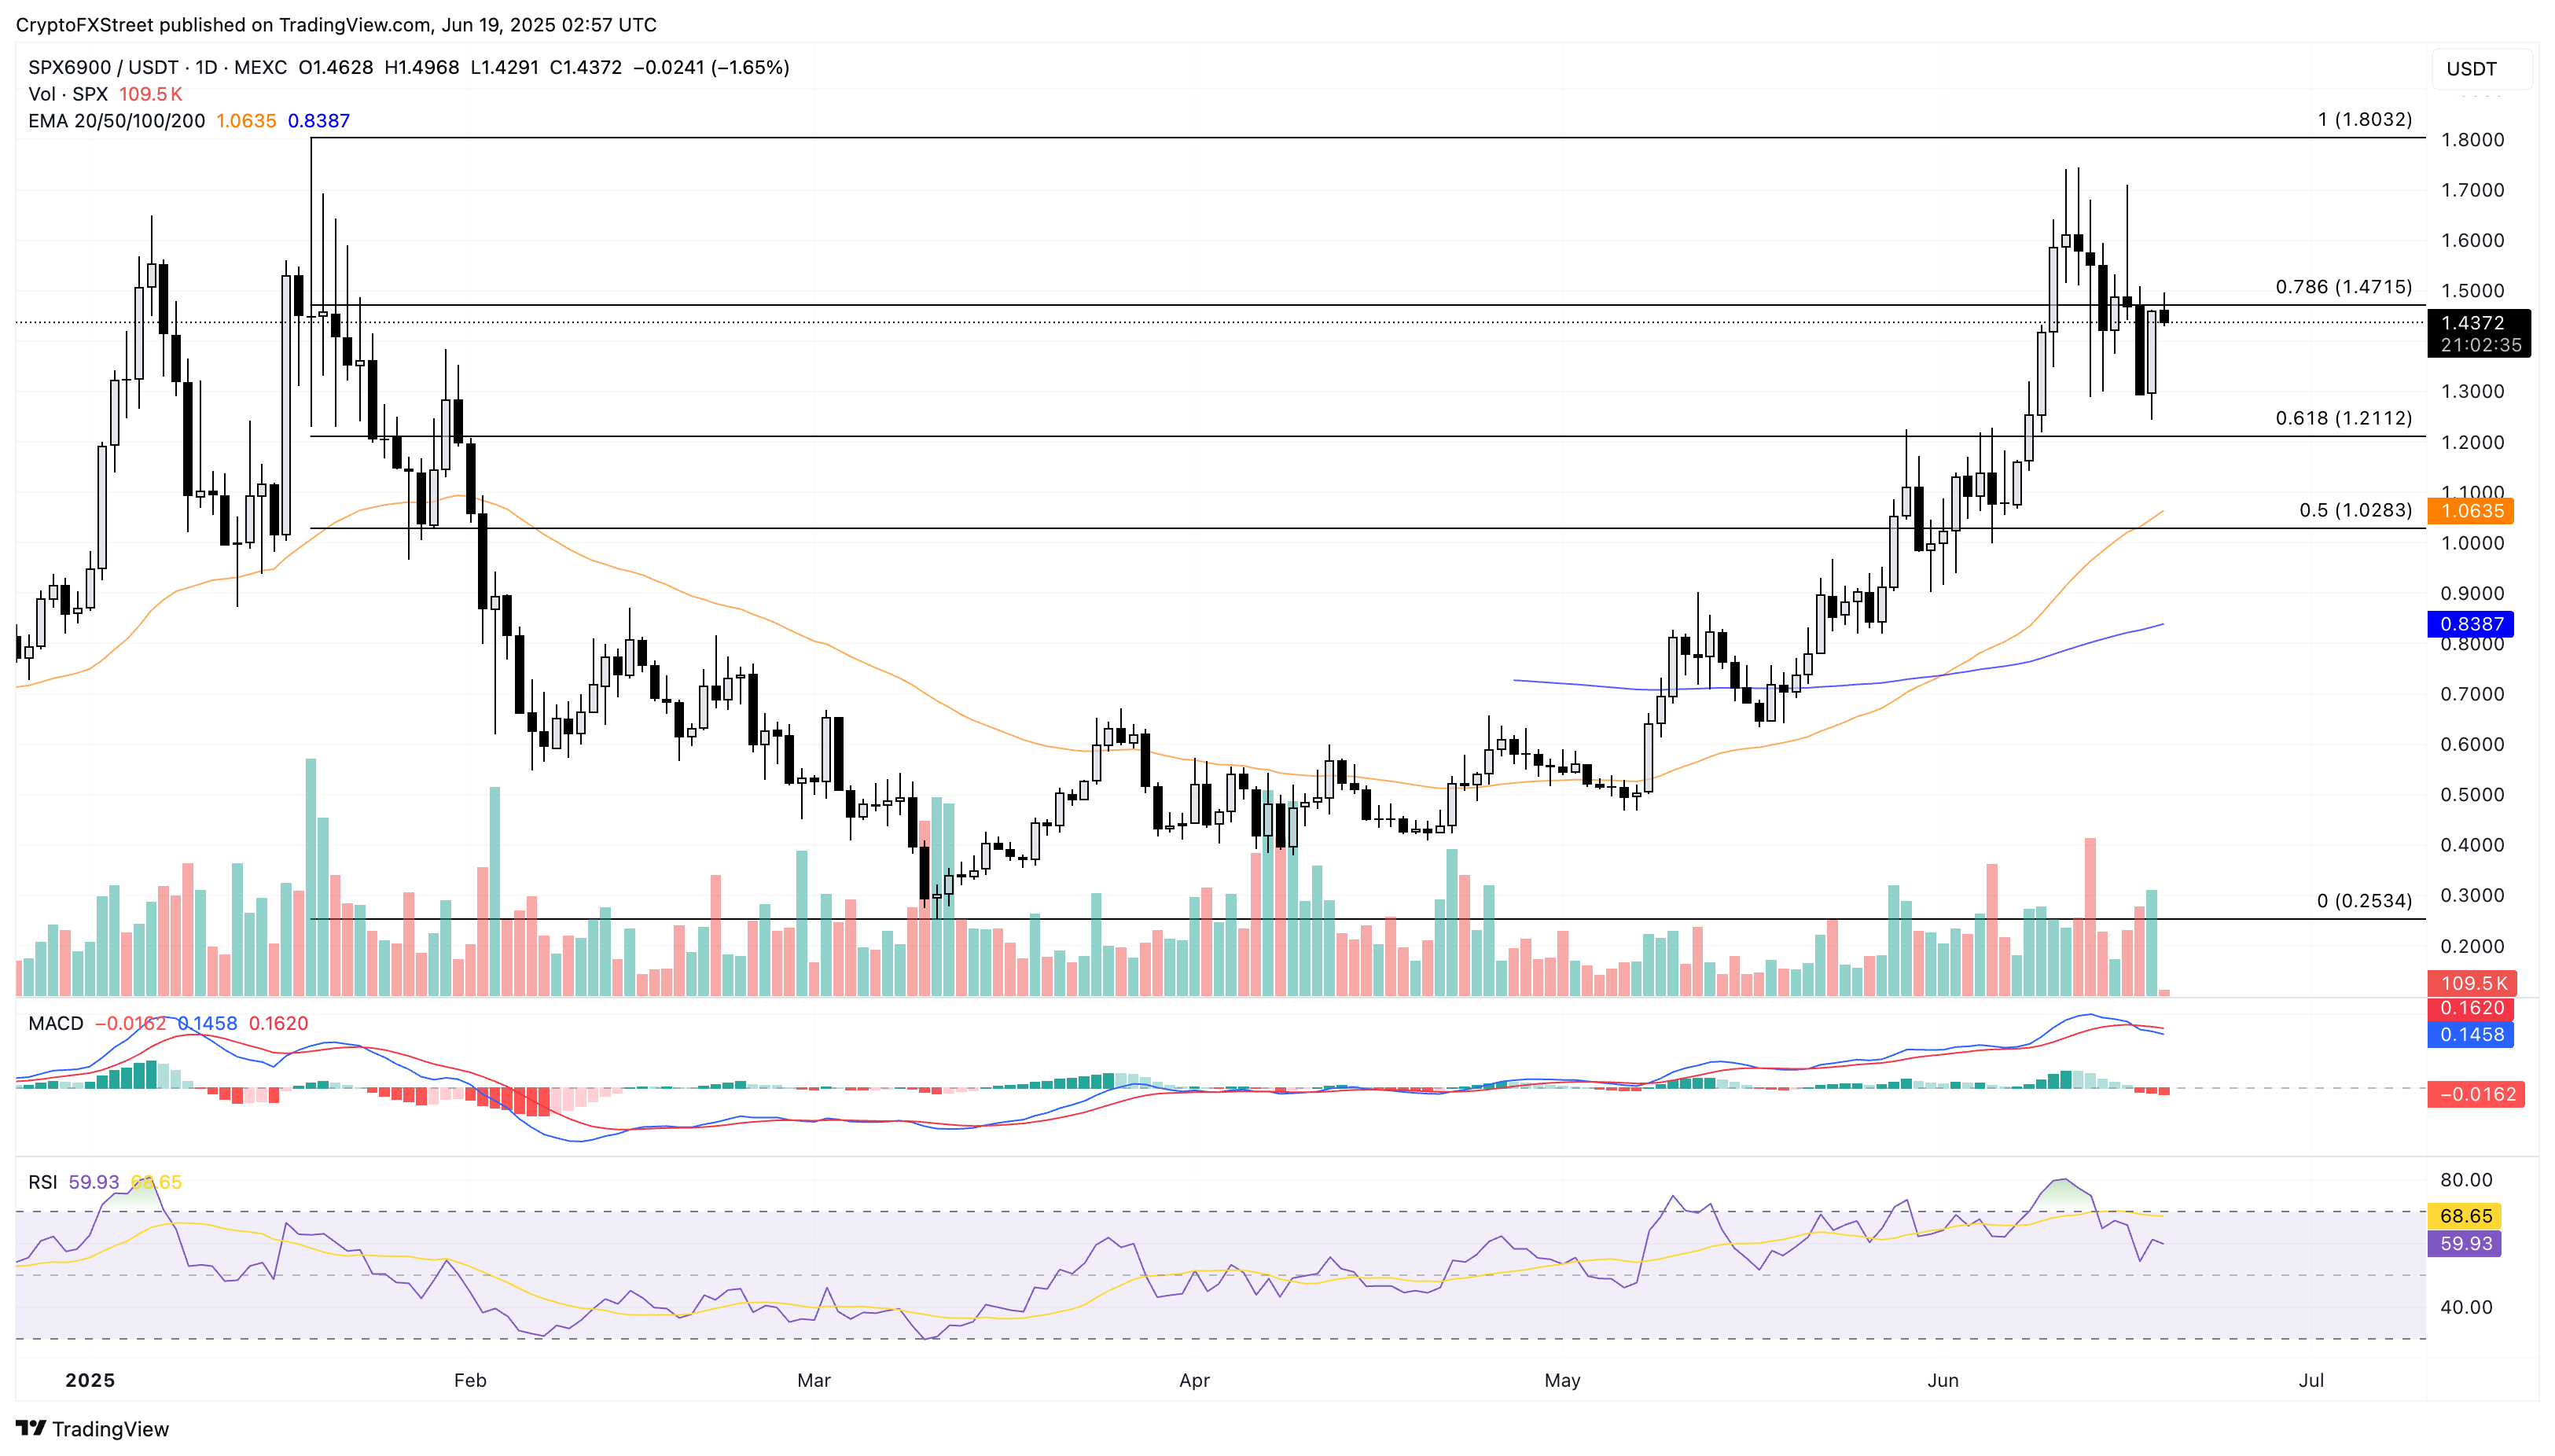
$SPX/$USDT daily price chart.
A bullish failure to cross above $1.47 could drop $SPX towards the 61.8% Fibonacci level at $1.21.