VeChain recorded a 5% intraday drop after failing to cross the 50-day EMA. Derivatives data show weak interest, raising the risk of a $0.02199 breakdown.
As the broader market struggles to find support, VeChain takes a bearish turn around the 50-day EMA, with a surge in selling pressure nearly undermining weekly gains. Will the downtrend break under the crucial $0.02199 support?
Vechain Price Analysis
On the daily chart, VeChain shows a V-shaped reversal, recovering from the three-day crash last week. The bullish trend produced five consecutive bullish candles.
The recovery rally saw five consecutive bullish candles, with the price rising from $0.02253 to $0.02630, a 16% surge. However, the uptrend failed to break above the 50-day EMA, resulting in a sudden 4.87% crash on Wednesday.
Due to recent fluctuations, the MACD and signal lines have flattened despite the earlier positive crossover. Hence, the technical indicators give mixed signals amid increased volatility in $VET prices. Notably, the declining trend in the 50-, 100-, and 200-day EMAs signals a bearish long-term outlook.
As selling pressure revives, the altcoin broke below the $0.02471 support level. VeChain extended its losses with a 5.17% intraday drop, trading at $0.02222. Thus, the likelihood of $VET retesting the $0.02199 horizontal support has increased.
A potential closing below the immediate support could extend the correction to the psychological level of $0.02000, followed by $0.01974. However, if $VET avoids closing below $0.02471, a potential bounce back to the 50-day EMA at $0.02609 remains possible.
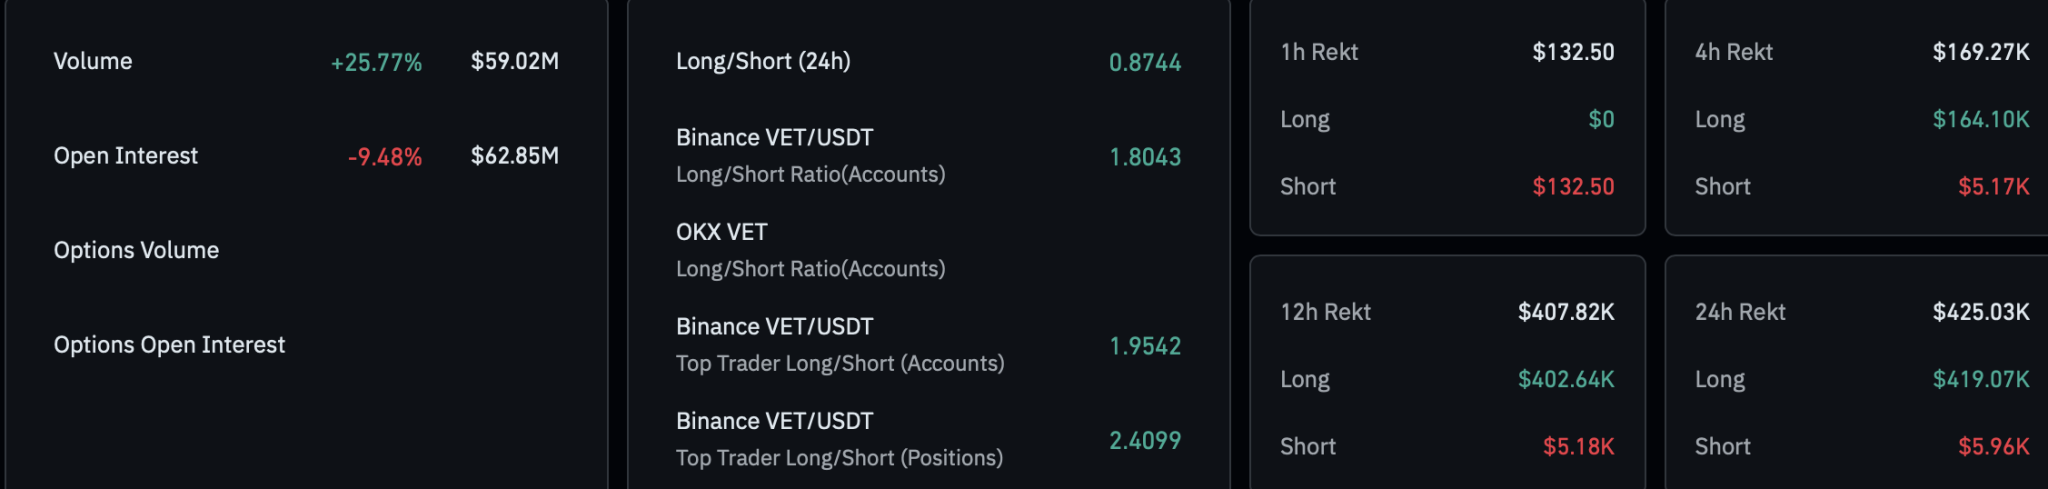
$VET Derivatives
As VeChain’s bearish trend re-emerges, optimism in the derivatives market takes a significant hit. Open interest dropped 9.48% to $62.85 million, signaling reduced trader interest.
Long liquidations reached $419k, while short liquidations remained below $6k. This reflects a substantial wipeout of bullish players. Consequently, the long/short ratio dropped to 0.8744, indicating an increased number of bearish positions.
With declining trader interest, derivatives data suggest a high likelihood of continued bearish momentum.