
Shiba Inu ($SHIB) is struggling to break out of a falling channel pattern after a short-lived rally. Amid bearish pressure from derivatives and profit-taking by long-term holders, will $SHIB drop to the key support level at $0.000010?
With a pullback among top meme coins, Shiba Inu continues to face challenges escaping the falling channel pattern. Will $SHIB surpass the overhead trendline or fall to the critical $0.000010 support level?
Shiba Inu Price Analysis
Shiba Inu has been exhibiting a falling channel pattern since early May, when it failed to break above $0.000017. After dropping below the 50-day EMA, the meme coin reached a monthly low near $0.000012.
Currently, $SHIB is trading at $0.00001288, experiencing an intraday pullback of nearly 2%. Despite a 5% price surge on Monday, which hinted at a potential breakout from the falling channel, the intraday pullback signals a possible bearish reversal.
However, the MACD and signal lines are approaching a bullish crossover, indicating potential momentum.
In the event of a breakout rally, the 23.6% Fibonacci level at $0.00001590 is a key price target. Short-term resistance lies at the 100-day EMA at $0.00001418.
Conversely, critical support remains at the lower boundary of the falling channel and the psychological $0.000010 level.
Long-term Investors Book Profits
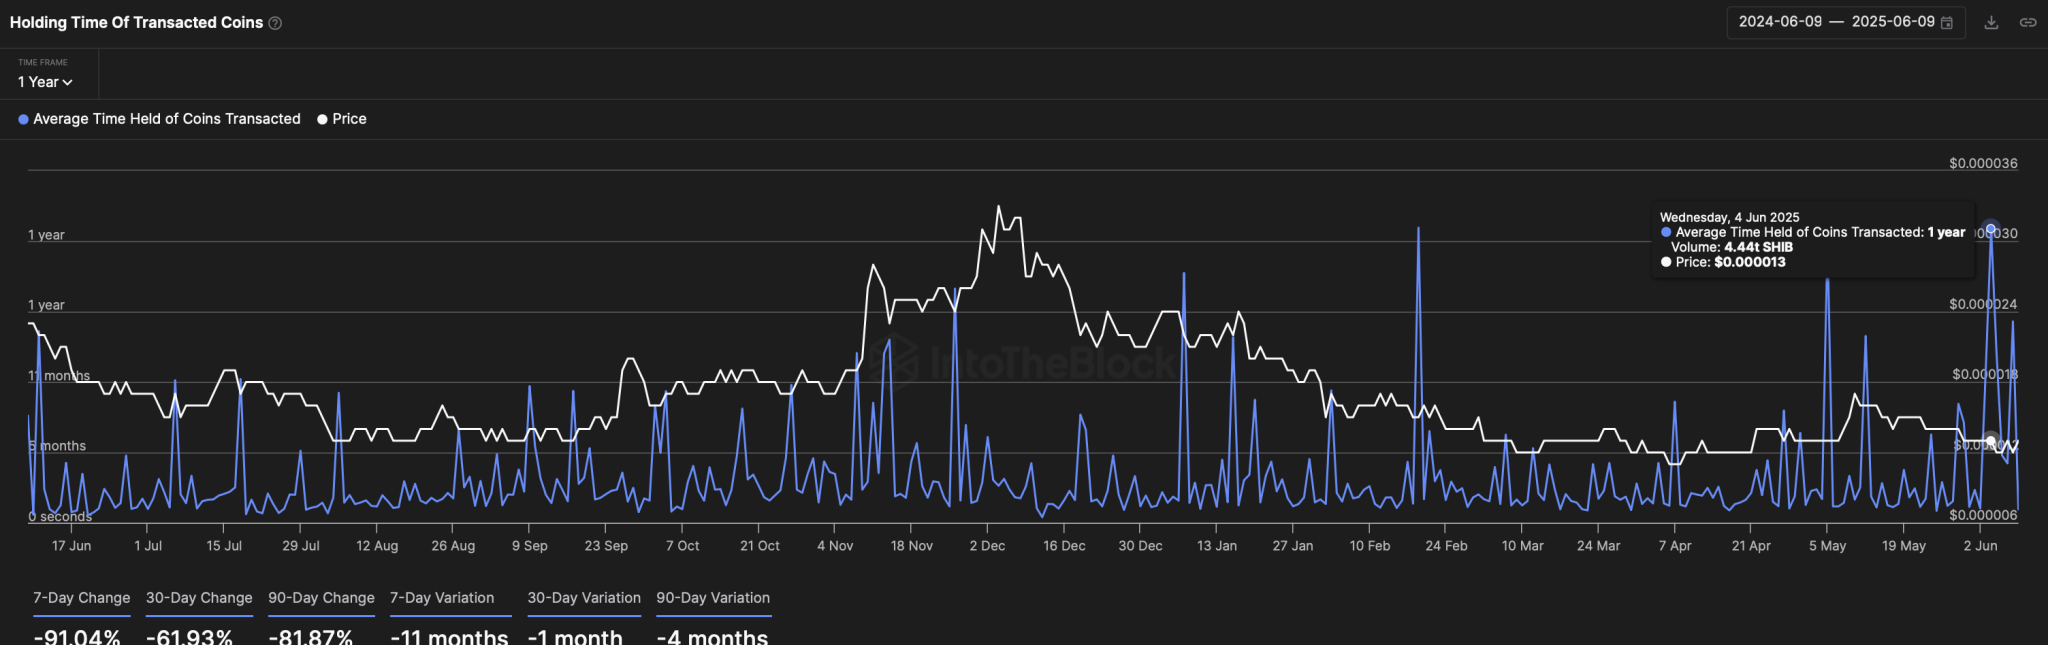
Amid the 6.3% price crash on June 5, Shiba Inu on-chain data reveals significant profit-taking by long-term investors on June 4. According to IntoTheBlock’s Holding Time of Transacted Coins indicator, 4.44 trillion $SHIB tokens, with an average holding period of one year, were sold, reflecting sales likely at a profit given the price levels before the crash.
This reflects substantial profit-taking by investors who held Shiba Inu tokens for nearly a year, signaling declining confidence.
Derivatives Traders Anticipate Pullback in $SHIB
With the intraday pullback, the Coinglass data showcases a surge in bearish pressure in Shiba Inu derivatives. The long-to-short ratio chart indicates that short positions have increased to 53.66% over the past four hours, reducing the long-to-short ratio to 0.8636.
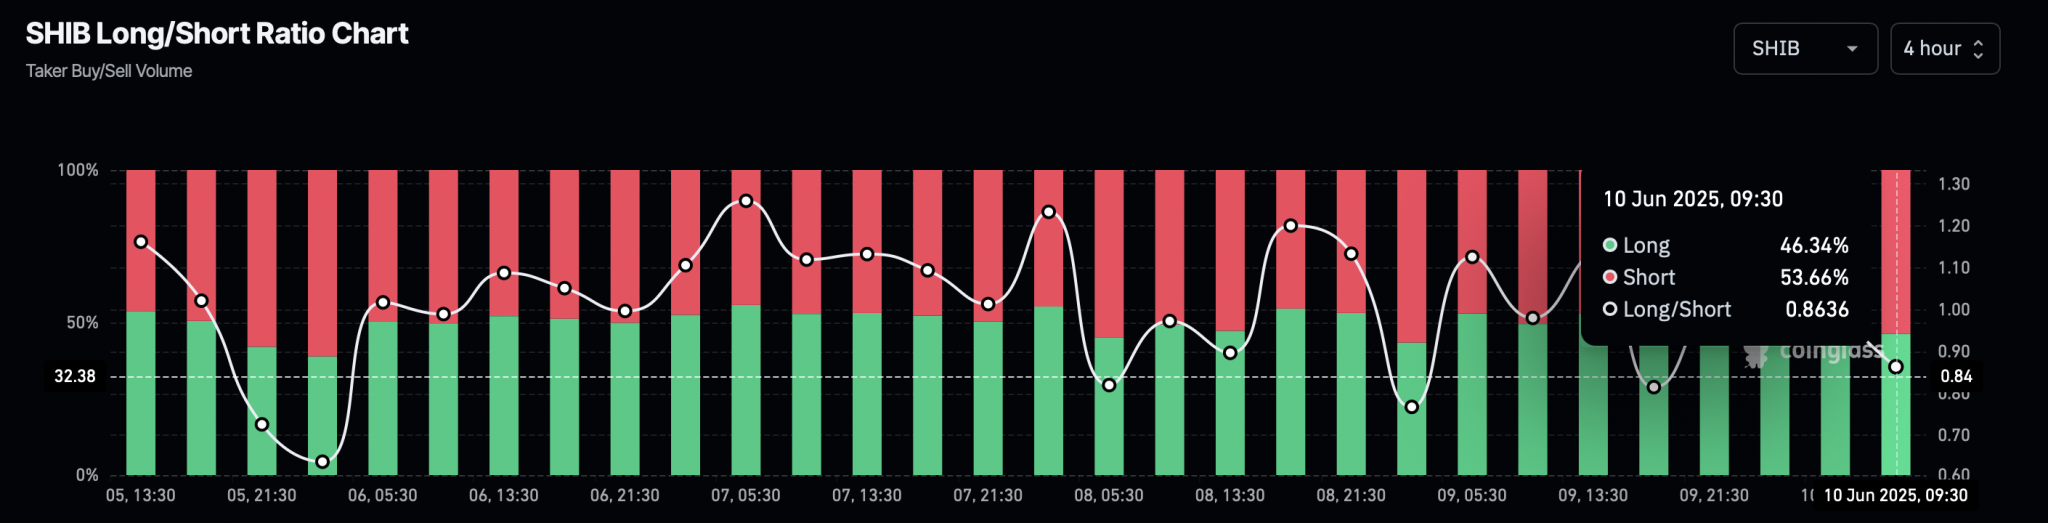
This suggests a greater bearish influence, anticipating a steeper correction in Shiba Inu.